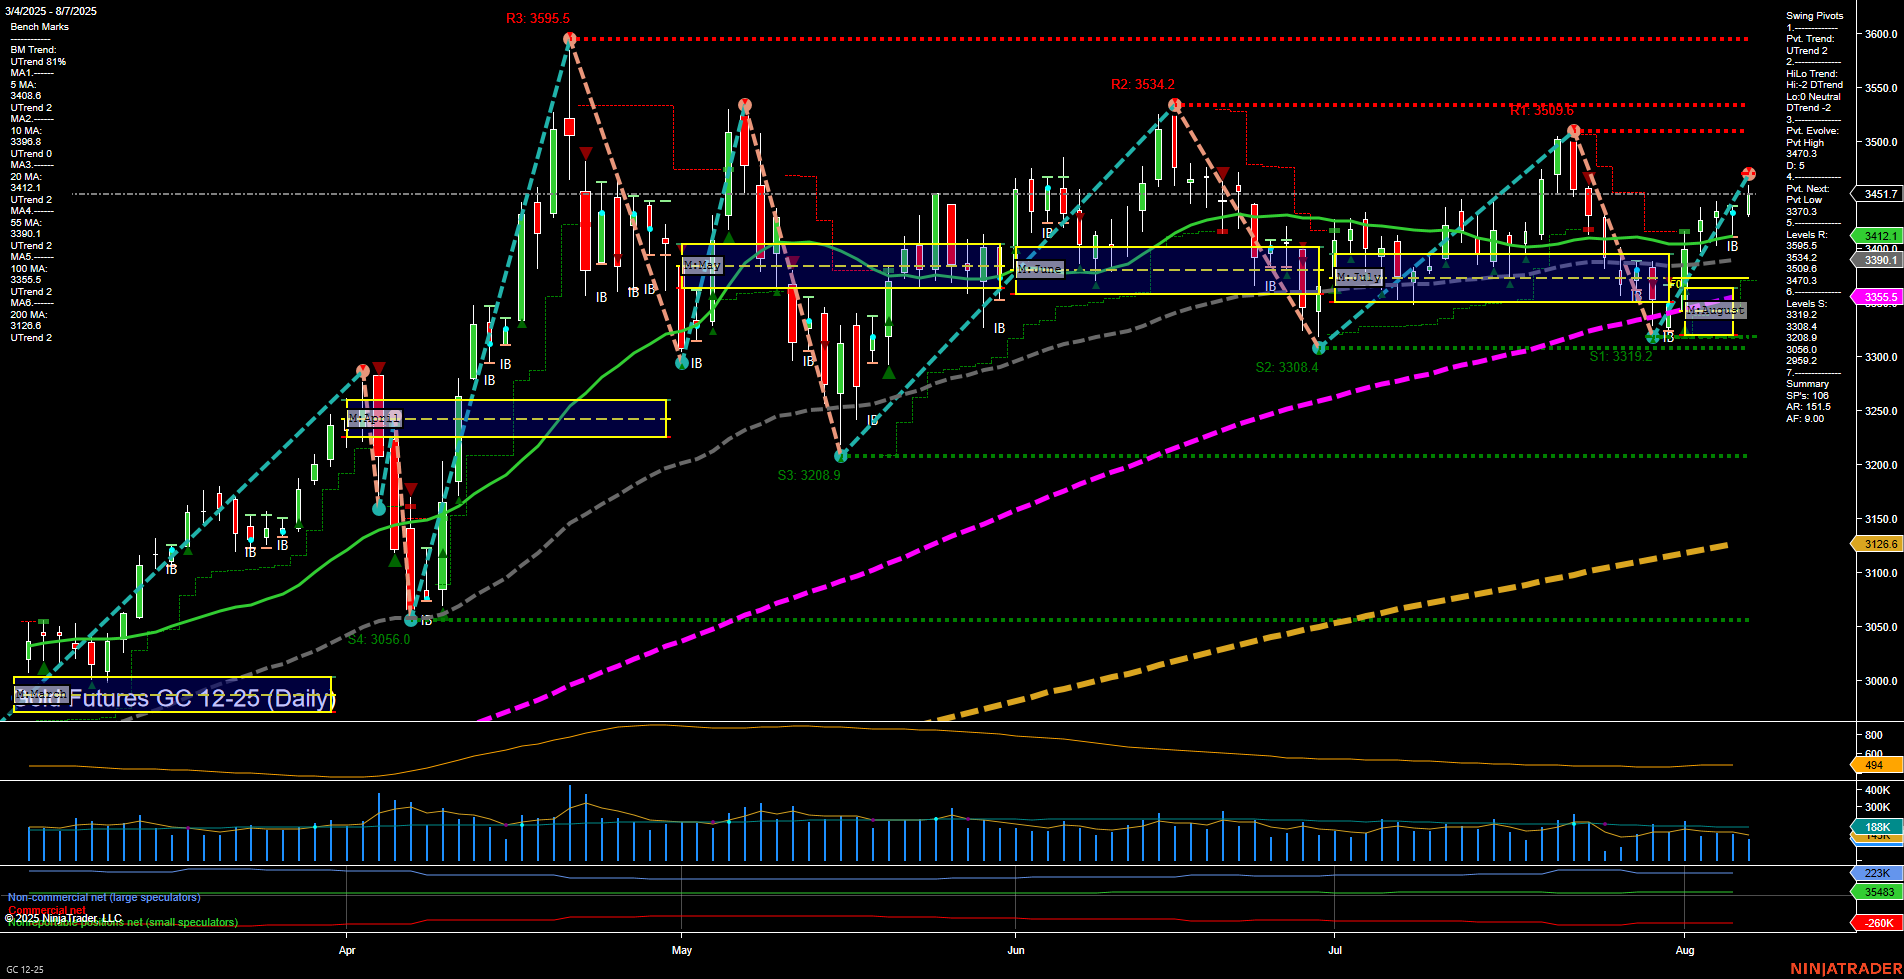
GC Gold Futures Daily Chart Analysis: 2025-Aug-07 07:09 CT
Price Action
- Last: 3470.3,
- Bars: Medium,
- Mom: Average.
WSFG Weekly
- Short-Term
- WSFG Current: 36%
- F0%/NTZ' Bias: Price Above,
- WSFG Trend: Up.
MSFG Month Aug
- Intermediate-Term
- MSFG Current: 36%
- F0%/NTZ' Bias: Price Above,
- MSFG Trend: Up.
YSFG Year 2025
- Long-Term
- YSFG Current: 188%
- F0%/NTZ' Bias: Price Above,
- YSFG Trend: Up.
Swing Pivots
- (Short-Term) 1. Pvt. Trend: UTrend,
- (Intermediate-Term) 2. HiLo Trend: DTrend,
- 3. Pvt. Evolve: Pvt High 3470.3,
- 4. Pvt. Next: Pvt Low 3415.7,
- 5. Levels R: 3595.5, 3534.2, 3508.0, 3470.3,
- 6. Levels S: 3415.7, 3390.1, 3308.4, 3208.9, 3056.0, 2952.2.
Daily Benchmarks
- (Short-Term) 5 Day: 3440.6 Up Trend,
- (Short-Term) 10 Day: 3398.8 Up Trend,
- (Intermediate-Term) 20 Day: 3412.1 Up Trend,
- (Intermediate-Term) 55 Day: 3351.6 Up Trend,
- (Long-Term) 100 Day: 3236.4 Up Trend,
- (Long-Term) 200 Day: 3126.6 Up Trend.
Additional Metrics
Recent Trade Signals
- 06 Aug 2025: Long GC 12-25 @ 3428.6 Signals.USAR-WSFG
- 05 Aug 2025: Long GC 12-25 @ 3444.1 Signals.USAR.TR720
- 04 Aug 2025: Long GC 12-25 @ 3410.9 Signals.USAR-MSFG
- 01 Aug 2025: Long GC 12-25 @ 3401.2 Signals.USAR.TR120
Overall Rating
- Short-Term: Bullish,
- Intermediate-Term: Neutral,
- Long-Term: Bullish.
Key Insights Summary
Gold futures are exhibiting a strong bullish structure in both the short- and long-term, with price action consistently above key moving averages and the F0%/NTZ levels across weekly, monthly, and yearly session fib grids. The short-term swing pivot trend is up, supported by a series of recent long trade signals and higher lows, while the intermediate-term trend is more neutral due to a downward HiLo trend, suggesting some consolidation or a possible pause in the uptrend. Resistance levels are layered above, with the most immediate at 3470.3 and significant resistance at 3595.5, while support is well-defined below at 3415.7 and 3390.1. Volatility remains moderate, and volume is steady, indicating healthy participation. The overall technical landscape favors trend continuation, but the presence of both higher resistance and a neutral intermediate-term pivot trend points to a market that may be preparing for either a breakout or a period of sideways consolidation before the next directional move.
Chart Analysis ATS AI Generated: 2025-08-07 07:10 for Informational use only, not trading advice. Terms and Risk Disclosure Copyright © 2025. Algo Trading Systems LLC.
