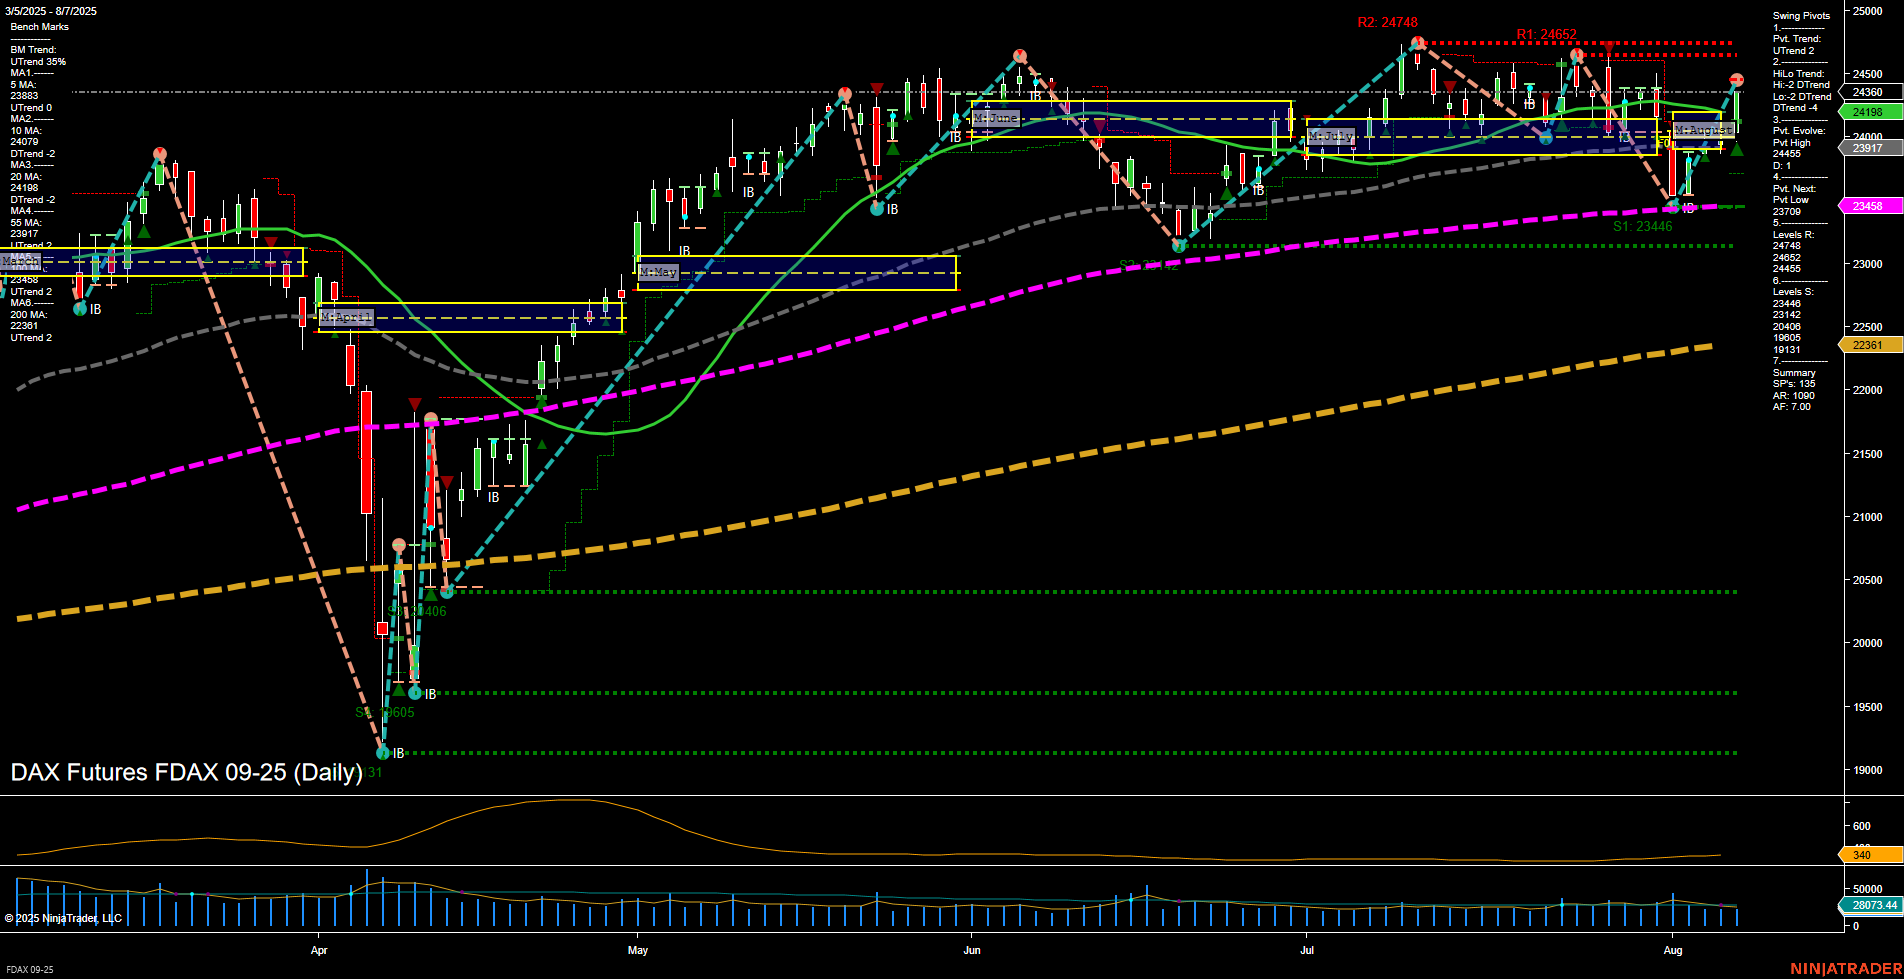
FDAX DAX Futures Daily Chart Analysis: 2025-Aug-07 07:08 CT
Price Action
- Last: 24360,
- Bars: Medium,
- Mom: Momentum average.
WSFG Weekly
- Short-Term
- WSFG Current: 106%
- F0%/NTZ' Bias: Price Above,
- WSFG Trend: Up.
MSFG Month Aug
- Intermediate-Term
- MSFG Current: 19%
- F0%/NTZ' Bias: Price Above,
- MSFG Trend: Up.
YSFG Year 2025
- Long-Term
- YSFG Current: 118%
- F0%/NTZ' Bias: Price Above,
- YSFG Trend: Up.
Swing Pivots
- (Short-Term) 1. Pvt. Trend: UTrend,
- (Intermediate-Term) 2. HiLo Trend: DTrend,
- 3. Pvt. Evolve: Pvt High 24652,
- 4. Pvt. Next: Pvt Low 23700,
- 5. Levels R: 24748, 24652, 24456, 24252, 24148,
- 6. Levels S: 23446, 22631, 19605, 19131.
Daily Benchmarks
- (Short-Term) 5 Day: 23833 Up Trend,
- (Short-Term) 10 Day: 24170 Up Trend,
- (Intermediate-Term) 20 Day: 24198 Up Trend,
- (Intermediate-Term) 55 Day: 23917 Up Trend,
- (Long-Term) 100 Day: 23458 Up Trend,
- (Long-Term) 200 Day: 22361 Up Trend.
Additional Metrics
Recent Trade Signals
- 07 Aug 2025: Long FDAX 09-25 @ 24385 Signals.USAR-MSFG
- 04 Aug 2025: Long FDAX 09-25 @ 23809 Signals.USAR.TR120
- 01 Aug 2025: Short FDAX 09-25 @ 23544 Signals.USAR.TR720
Overall Rating
- Short-Term: Bullish,
- Intermediate-Term: Neutral,
- Long-Term: Bullish.
Key Insights Summary
The FDAX daily chart shows a strong recovery and renewed upside momentum, with price action breaking above key moving averages and the NTZ/F0% levels across weekly, monthly, and yearly session fib grids. The short-term trend is bullish, supported by a series of higher lows and a recent swing pivot high, while all benchmark moving averages are trending up, confirming broad-based strength. Intermediate-term signals are more mixed, with the HiLo trend still in a downtrend, suggesting some caution as the market approaches resistance levels at 24652 and 24748. Volatility remains moderate (ATR 230), and volume is steady. The recent sequence of long trade signals aligns with the prevailing uptrend, but the proximity to major resistance and the potential for pullbacks or consolidation should be monitored. Overall, the technical structure favors the bulls in the short and long term, with the intermediate-term trend at a potential inflection point as the market tests overhead resistance.
Chart Analysis ATS AI Generated: 2025-08-07 07:08 for Informational use only, not trading advice. Terms and Risk Disclosure Copyright © 2025. Algo Trading Systems LLC.
