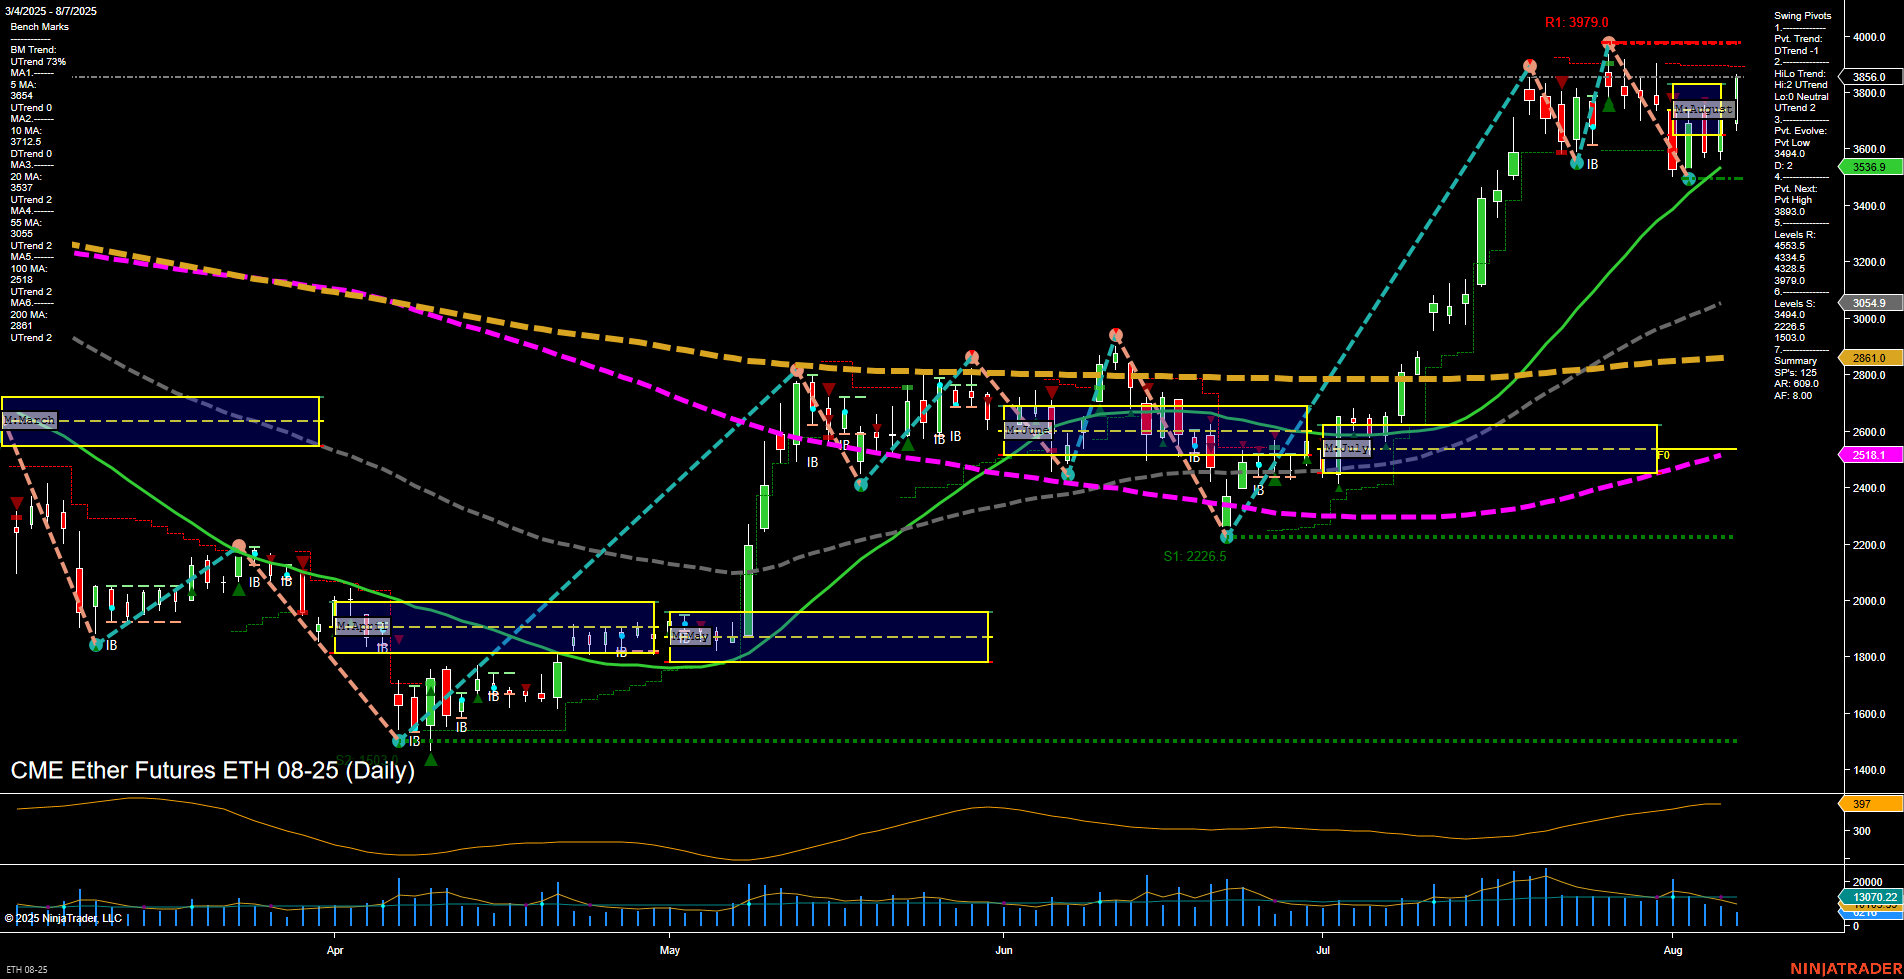
ETH CME Ether Futures Daily Chart Analysis: 2025-Aug-07 07:07 CT
Price Action
- Last: 3536.9,
- Bars: Medium,
- Mom: Momentum average.
WSFG Weekly
- Short-Term
- WSFG Current: 65%
- F0%/NTZ' Bias: Price Above,
- WSFG Trend: Up.
MSFG Month Aug
- Intermediate-Term
- MSFG Current: 15%
- F0%/NTZ' Bias: Price Above,
- MSFG Trend: Up.
YSFG Year 2025
- Long-Term
- YSFG Current: 14%
- F0%/NTZ' Bias: Price Above,
- YSFG Trend: Up.
Swing Pivots
- (Short-Term) 1. Pvt. Trend: DTrend,
- (Intermediate-Term) 2. HiLo Trend: UTrend,
- 3. Pvt. Evolve: Pvt Low 3440,
- 4. Pvt. Next: Pvt High 3979,
- 5. Levels R: 3979, 3883, 3856, 3734, 3434,
- 6. Levels S: 3054, 3000, 2861, 2518, 1503.
Daily Benchmarks
- (Short-Term) 5 Day: 3564 Up Trend,
- (Short-Term) 10 Day: 3472 Up Trend,
- (Intermediate-Term) 20 Day: 3537 Up Trend,
- (Intermediate-Term) 55 Day: 3172 Up Trend,
- (Long-Term) 100 Day: 2861 Up Trend,
- (Long-Term) 200 Day: 2518 Up Trend.
Additional Metrics
Recent Trade Signals
- 04 Aug 2025: Long ETH 08-25 @ 3704.5 Signals.USAR.TR120
- 04 Aug 2025: Short ETH 08-25 @ 3507 Signals.USAR-WSFG
- 04 Aug 2025: Short ETH 08-25 @ 3507 Signals.USAR-MSFG
Overall Rating
- Short-Term: Neutral,
- Intermediate-Term: Bullish,
- Long-Term: Bullish.
Key Insights Summary
ETH CME Ether Futures are currently consolidating after a strong rally, with price action showing medium-sized bars and average momentum. The short-term swing pivot trend has shifted to a downtrend, indicating a possible pullback or pause within the broader uptrend context. However, both intermediate and long-term trends remain firmly bullish, supported by all major moving averages trending upward and price holding above key session fib grid levels. Resistance is clustered near recent highs (3979, 3883), while support is well-defined below (3054, 3000). Recent trade signals reflect mixed short-term direction, but the overall structure suggests the market is digesting gains and could be setting up for the next directional move. Volatility remains elevated (ATR 431), and volume is robust, indicating active participation. The market is in a healthy uptrend on higher timeframes, with the current short-term consolidation likely serving as a base for future trend continuation or a deeper retracement if support levels are tested.
Chart Analysis ATS AI Generated: 2025-08-07 07:08 for Informational use only, not trading advice. Terms and Risk Disclosure Copyright © 2025. Algo Trading Systems LLC.
