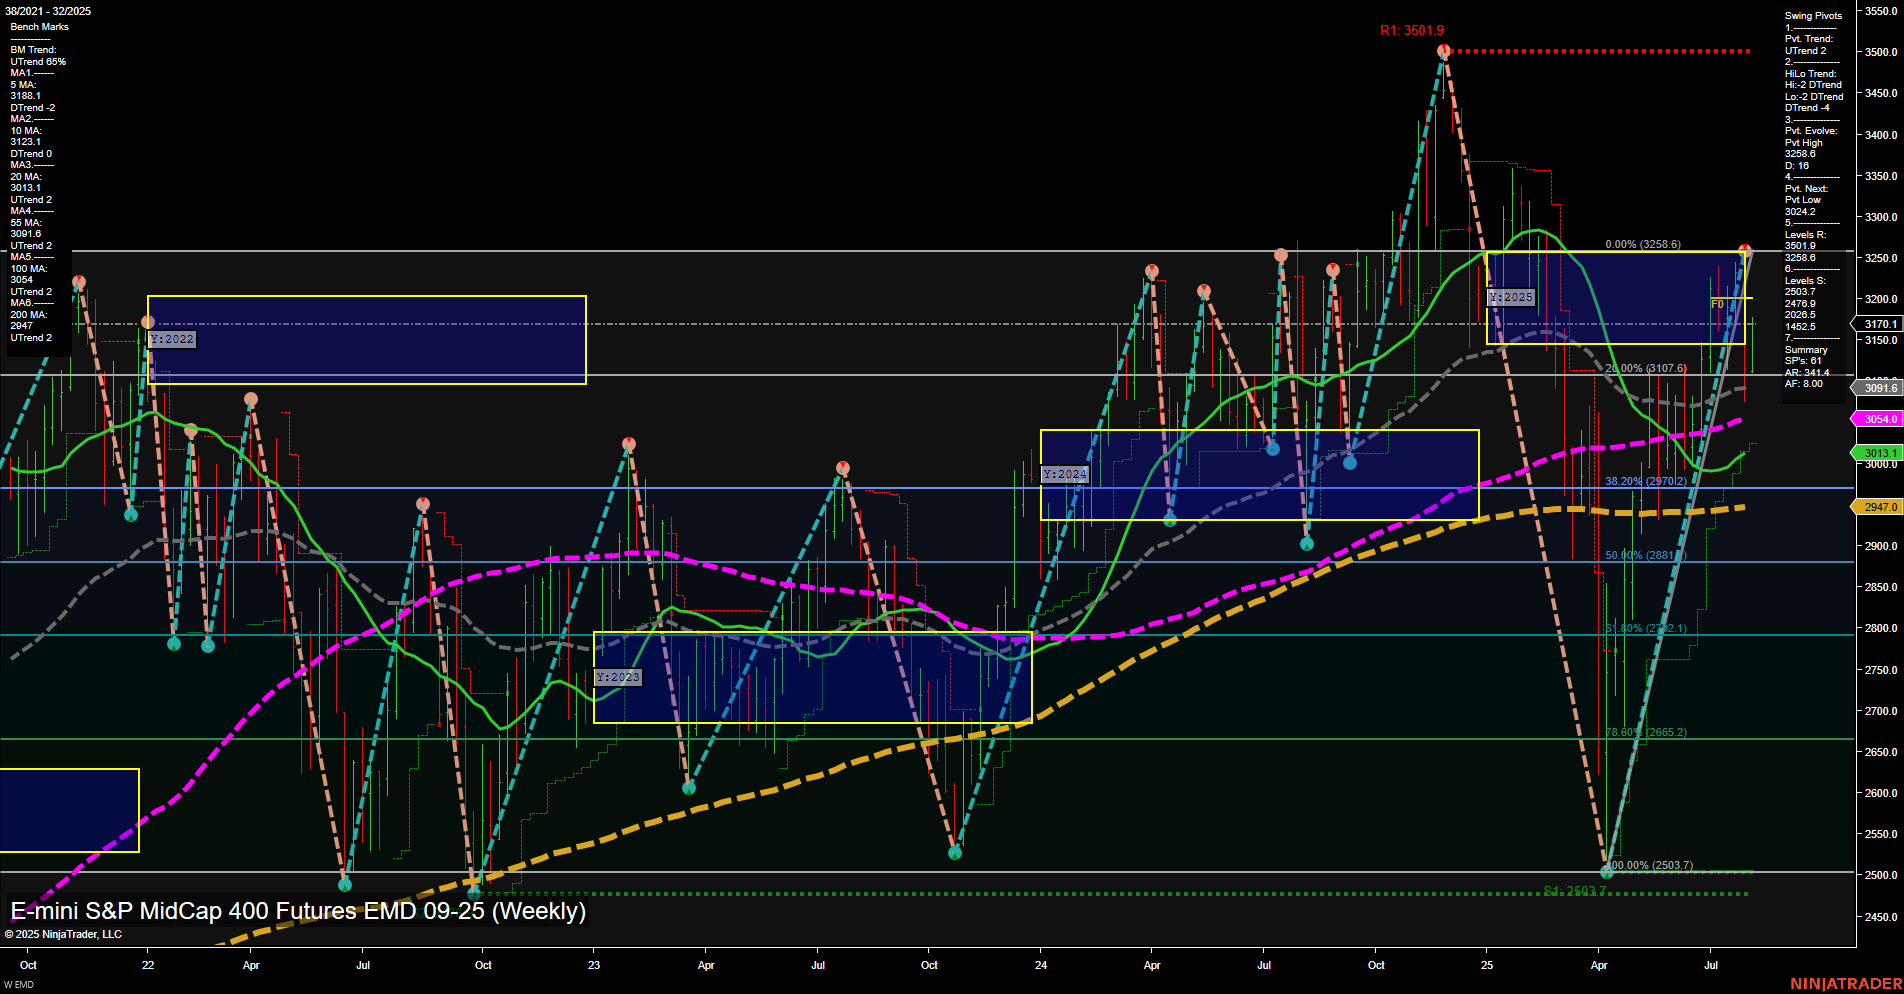
The EMD futures weekly chart shows a strong recovery and upside momentum in the short and intermediate term, with price action characterized by large bars and fast momentum. The WSFG and MSFG both indicate an uptrend, with price trading above their respective NTZ/F0% levels, confirming bullish sentiment for swing traders. The swing pivot structure supports this, with both short-term and intermediate-term trends in an uptrend, and the most recent pivot evolving at a high (3248.9), while the next key support is at 3042.2. Resistance is seen at the recent swing high and the major 3501.9 level. All benchmark moving averages from 5 to 200 weeks are trending up, reinforcing the underlying strength, though the yearly session fib grid (YSFG) still shows a long-term downtrend with price below its NTZ/F0%. This suggests that while the long-term structure is still in recovery from a prior downtrend, the current price action is in a strong counter-trend rally phase. Recent trade signals reflect active two-way trading, but the latest signal is long, in line with the prevailing short-term momentum. Overall, the market is in a bullish swing phase with strong upward momentum, but long-term context remains neutral as the market works through overhead resistance and prior structural highs. Swing traders will note the potential for further upside as long as support levels hold, but should remain aware of the broader long-term context and the possibility of volatility around major resistance zones.