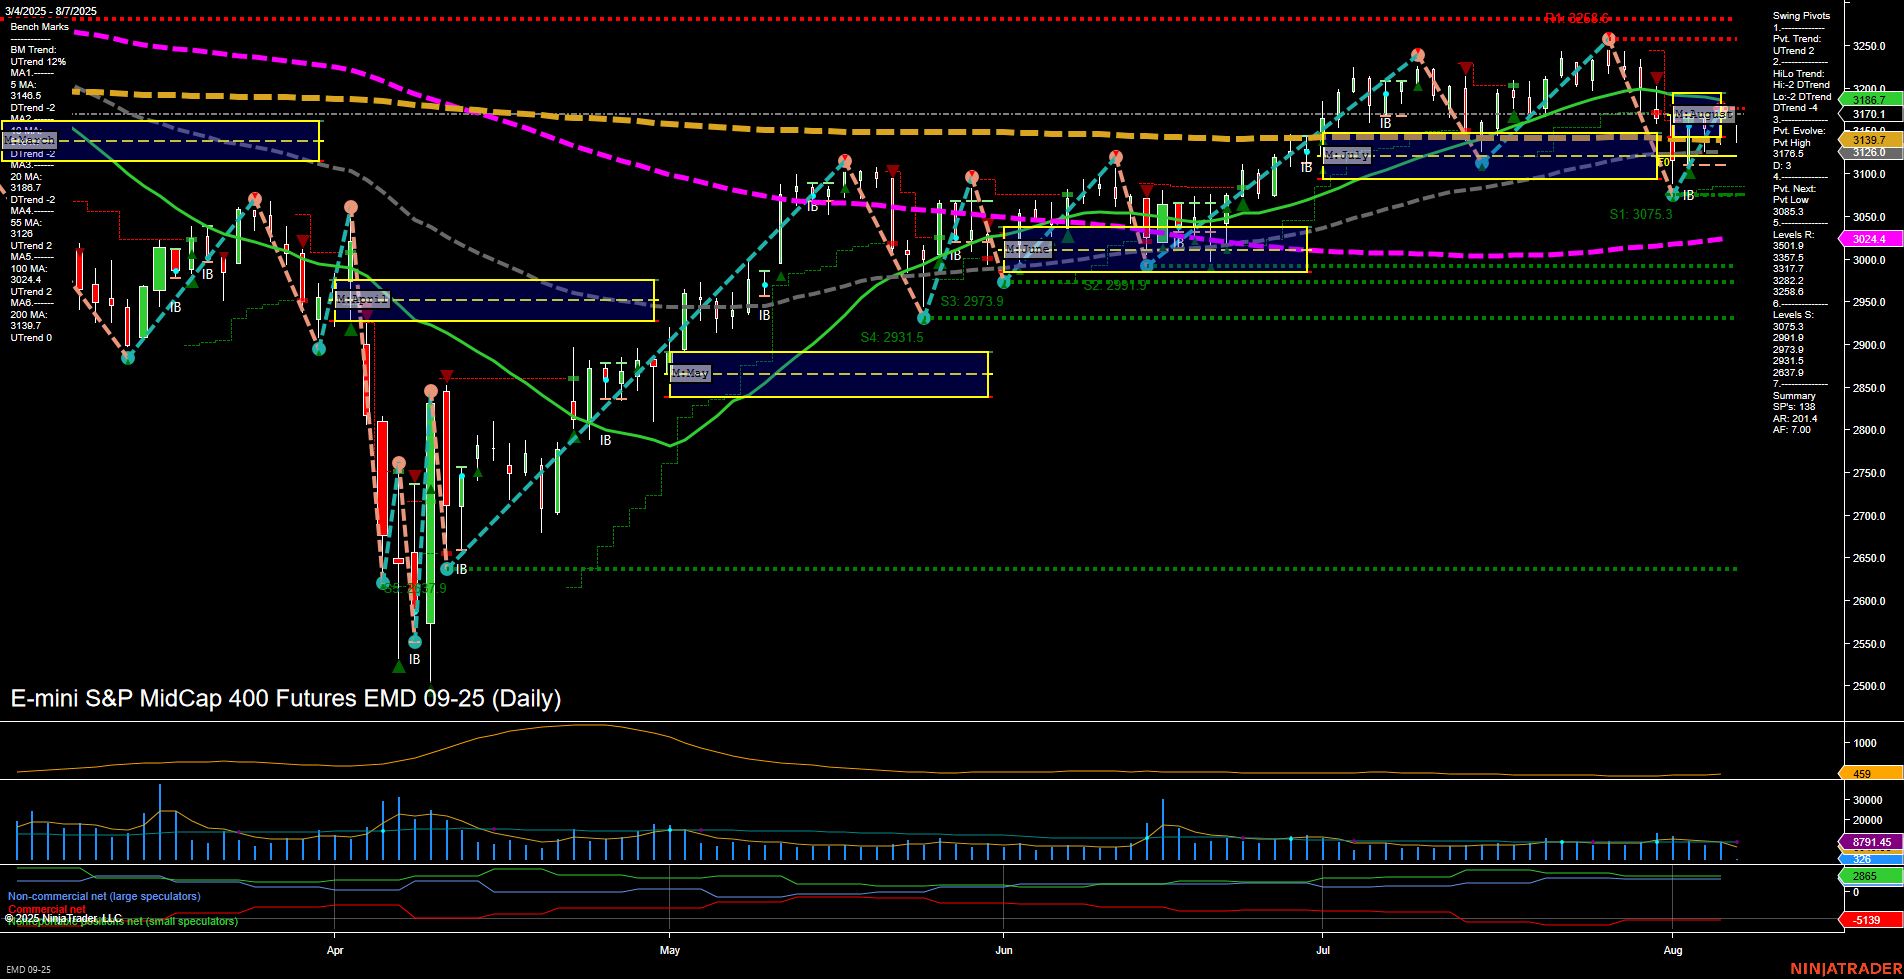
EMD E-mini S&P MidCap 400 Futures Daily Chart Analysis: 2025-Aug-07 07:05 CT
Price Action
- Last: 3139.7,
- Bars: Medium,
- Mom: Momentum average.
WSFG Weekly
- Short-Term
- WSFG Current: 56%
- F0%/NTZ' Bias: Price Above,
- WSFG Trend: Up.
MSFG Month Aug
- Intermediate-Term
- MSFG Current: 2%
- F0%/NTZ' Bias: Price Above,
- MSFG Trend: Up.
YSFG Year 2025
- Long-Term
- YSFG Current: -6%
- F0%/NTZ' Bias: Price Below,
- YSFG Trend: Down.
Swing Pivots
- (Short-Term) 1. Pvt. Trend: UTrend,
- (Intermediate-Term) 2. HiLo Trend: DTrend,
- 3. Pvt. Evolve: Pvt High 3170.1,
- 4. Pvt. Next: Pvt Low 3024.4,
- 5. Levels R: 3256.6, 3237.5, 3228.6, 3186.7, 3170.1,
- 6. Levels S: 3075.3, 2973.9, 2931.5, 2911.5, 2873.9.
Daily Benchmarks
- (Short-Term) 5 Day: 3146.5 Up Trend,
- (Short-Term) 10 Day: 3140.2 Up Trend,
- (Intermediate-Term) 20 Day: 3186.7 Down Trend,
- (Intermediate-Term) 55 Day: 3132.6 Up Trend,
- (Long-Term) 100 Day: 3024.4 Up Trend,
- (Long-Term) 200 Day: 3075.3 Up Trend.
Additional Metrics
Recent Trade Signals
- 04 Aug 2025: Long EMD 09-25 @ 3156.1 Signals.USAR.TR120
- 01 Aug 2025: Short EMD 09-25 @ 3118 Signals.USAR.TR720
- 30 Jul 2025: Short EMD 09-25 @ 3231.4 Signals.USAR-WSFG
Overall Rating
- Short-Term: Bullish,
- Intermediate-Term: Neutral,
- Long-Term: Neutral.
Key Insights Summary
The EMD futures daily chart shows a market in transition. Short-term momentum is positive, with price action above key short-term moving averages and the weekly session fib grid (WSFG) indicating an uptrend. The most recent swing pivot trend is up, and the last trade signal was a long entry, supporting a bullish short-term outlook. However, the intermediate-term picture is mixed: the monthly session fib grid (MSFG) is up, but the HiLo trend from swing pivots is down, and the 20-day moving average is trending lower, suggesting some resistance to further upside. Long-term metrics are neutral, with the yearly fib grid trend down but most long-term moving averages still in uptrends, indicating a market that has not fully committed to a new long-term direction. Volatility remains moderate, and volume is steady. The market is currently trading between key resistance at 3170–3186 and support at 3075, with a recent bounce from support but facing overhead resistance. This setup suggests a choppy, range-bound environment with potential for short-term rallies but lacking strong conviction for a sustained trend in either direction.
Chart Analysis ATS AI Generated: 2025-08-07 07:06 for Informational use only, not trading advice. Terms and Risk Disclosure Copyright © 2025. Algo Trading Systems LLC.
