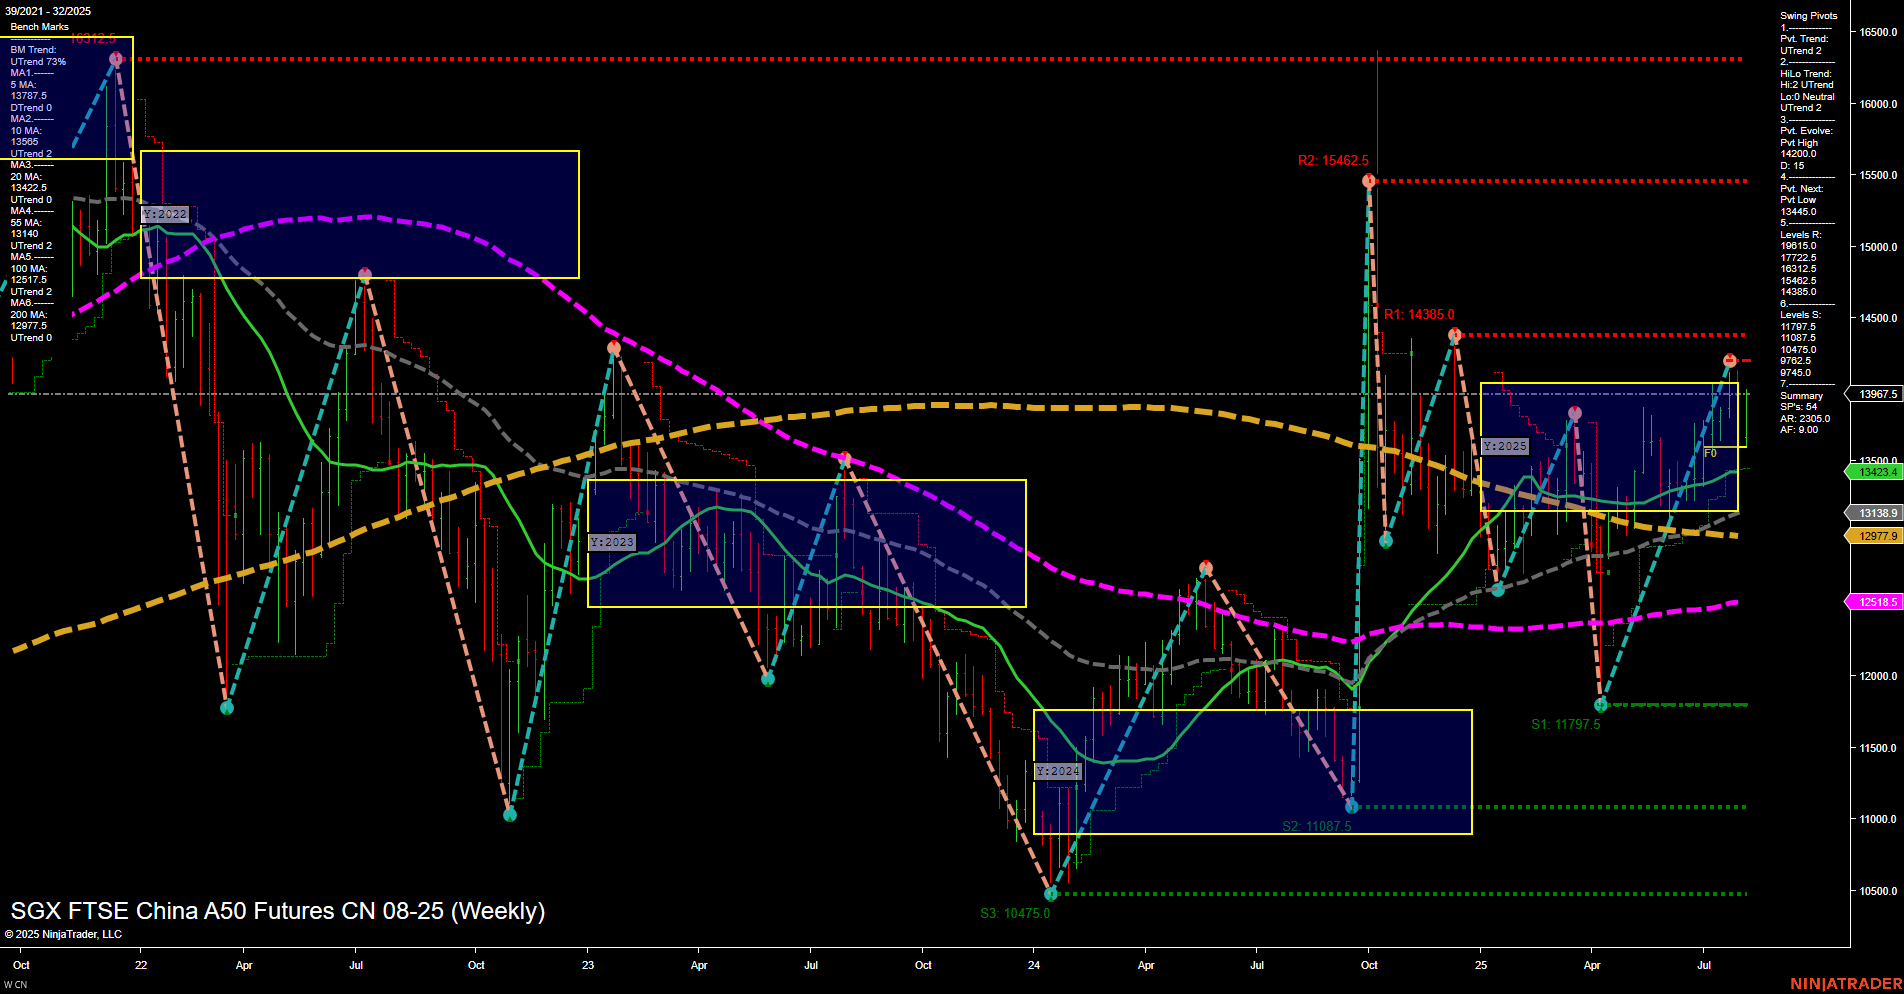
CN SGX FTSE China A50 Futures Weekly Chart Analysis: 2025-Aug-07 07:05 CT
Price Action
- Last: 13,967.5,
- Bars: Medium,
- Mom: Momentum average.
WSFG Weekly
- Short-Term
- WSFG Current: NA%
- F0%/NTZ' Bias: Price Neutral,
- WSFG Trend: Neutral.
MSFG Month Aug
- Intermediate-Term
- MSFG Current: NA%
- F0%/NTZ' Bias: Price Neutral,
- MSFG Trend: Neutral.
YSFG Year 2025
- Long-Term
- YSFG Current: NA%
- F0%/NTZ' Bias: Price Neutral,
- YSFG Trend: Neutral.
Swing Pivots
- (Short-Term) 1. Pvt. Trend: UTrend,
- (Intermediate-Term) 2. HiLo Trend: UTrend,
- 3. Pvt. Evolve: Pvt high 14,200,
- 4. Pvt. Next: Pvt low 13,445,
- 5. Levels R: 15,462.5, 14,385, 14,200, 13,967.5,
- 6. Levels S: 11,797.5, 11,087.5, 10,475, 9,745.
Weekly Benchmarks
- (Intermediate-Term) 5 Week: 13,787.5 Up Trend,
- (Intermediate-Term) 10 Week: 13,106.5 Up Trend,
- (Long-Term) 20 Week: 13,424.3 Up Trend,
- (Long-Term) 55 Week: 12,979.7 Up Trend,
- (Long-Term) 100 Week: 12,518.5 Down Trend,
- (Long-Term) 200 Week: 12,077.5 Up Trend.
Overall Rating
- Short-Term: Bullish,
- Intermediate-Term: Bullish,
- Long-Term: Bullish.
Key Insights Summary
The CN SGX FTSE China A50 Futures weekly chart shows a market that has transitioned into a bullish phase across short, intermediate, and long-term horizons. Price action is characterized by medium-sized bars and average momentum, indicating steady participation without excessive volatility. The swing pivot structure highlights a recent upward trend, with the most recent pivot high at 14,200 and the next key support at 13,445, suggesting the market is currently testing resistance zones after a strong recovery from earlier lows. All key moving averages (except the 100-week) are trending upward, reinforcing the bullish outlook, while the 100-week MA lags but may soon turn if the current trend persists. The price is consolidating near the upper end of the yearly session fib grid, with neutral bias across all session grids, indicating a pause or potential for further breakout if resistance levels are cleared. The overall structure suggests a market in the midst of a recovery cycle, with higher lows and higher highs forming, and a possible continuation of the uptrend if momentum sustains above key support levels.
Chart Analysis ATS AI Generated: 2025-08-07 07:05 for Informational use only, not trading advice. Terms and Risk Disclosure Copyright © 2025. Algo Trading Systems LLC.
