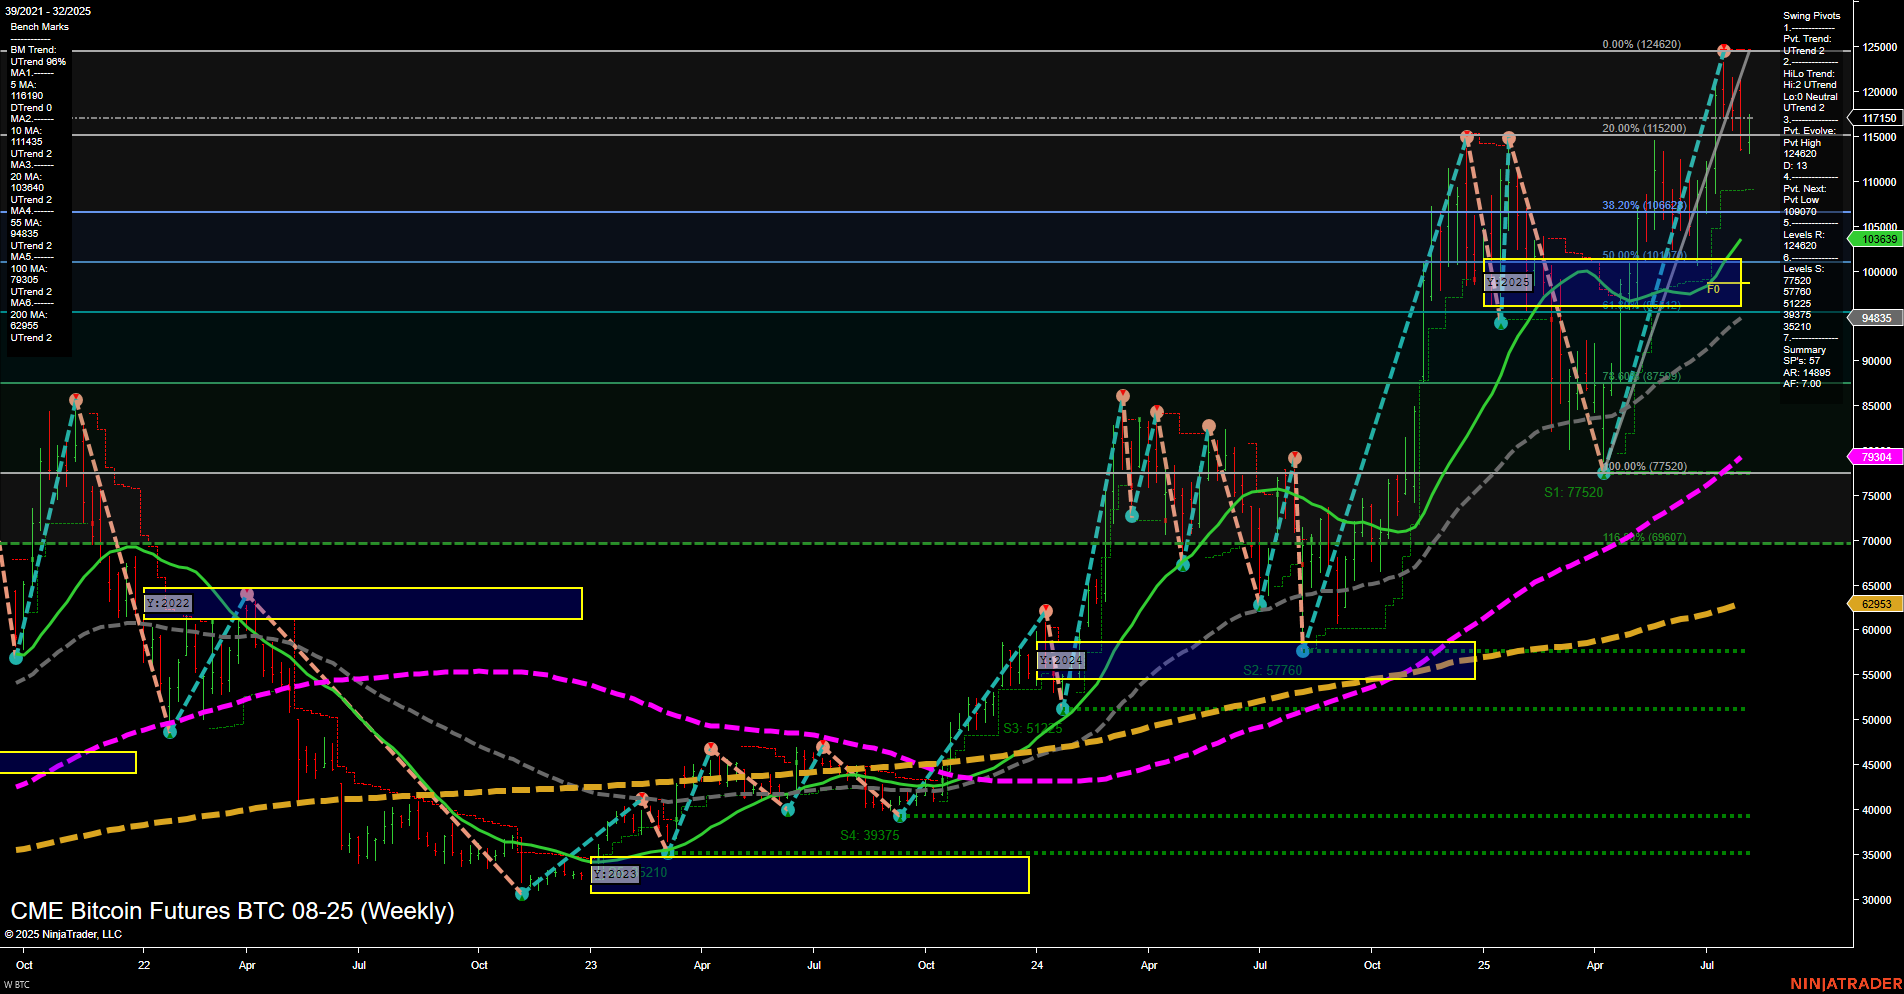
BTC CME Bitcoin Futures Weekly Chart Analysis: 2025-Aug-07 07:03 CT
Price Action
- Last: 105090,
- Bars: Large,
- Mom: Momentum fast.
WSFG Weekly
- Short-Term
- WSFG Current: 34%
- F0%/NTZ' Bias: Price Above,
- WSFG Trend: Up.
MSFG Month Aug
- Intermediate-Term
- MSFG Current: 7%
- F0%/NTZ' Bias: Price Above,
- MSFG Trend: Up.
YSFG Year 2025
- Long-Term
- YSFG Current: 70%
- F0%/NTZ' Bias: Price Above,
- YSFG Trend: Up.
Swing Pivots
- (Short-Term) 1. Pvt. Trend: UTrend,
- (Intermediate-Term) 2. HiLo Trend: UTrend,
- 3. Pvt. Evolve: Pvt high 124620,
- 4. Pvt. Next: Pvt low 103390,
- 5. Levels R: 124620, 115200, 106620,
- 6. Levels S: 103390, 97750, 77520, 57760, 39375, 3210.
Weekly Benchmarks
- (Intermediate-Term) 5 Week: 111040 Up Trend,
- (Intermediate-Term) 10 Week: 111435 Up Trend,
- (Long-Term) 20 Week: 103690 Up Trend,
- (Long-Term) 55 Week: 95365 Up Trend,
- (Long-Term) 100 Week: 79904 Up Trend,
- (Long-Term) 200 Week: 62935 Up Trend.
Recent Trade Signals
- 06 Aug 2025: Long BTC 08-25 @ 115775 Signals.USAR-WSFG
- 05 Aug 2025: Short BTC 08-25 @ 113305 Signals.USAR-MSFG
- 05 Aug 2025: Short BTC 08-25 @ 113305 Signals.USAR.TR720
- 31 Jul 2025: Short BTC 08-25 @ 117450 Signals.USAR.TR120
Overall Rating
- Short-Term: Bullish,
- Intermediate-Term: Bullish,
- Long-Term: Bullish.
Key Insights Summary
The BTC CME Bitcoin Futures weekly chart shows a strong bullish structure across all timeframes. Price action is characterized by large bars and fast momentum, indicating heightened volatility and active participation. The price remains above all key Fibonacci grid levels (WSFG, MSFG, YSFG), with each session grid trending upward, confirming a persistent uptrend. Swing pivot analysis highlights a recent pivot high at 124620 and a next potential support pivot at 103390, with resistance levels stacked above and multiple support levels below, suggesting a healthy trend with room for pullbacks. All benchmark moving averages (5, 10, 20, 55, 100, 200 week) are trending up, reinforcing the long-term bullish bias. Recent trade signals show a mix of short and long entries, reflecting tactical responses to short-term volatility within the broader uptrend. Overall, the chart reflects a robust uptrend with strong momentum, higher highs, and higher lows, supported by both technical and cyclical factors, with the potential for continued volatility and trend continuation.
Chart Analysis ATS AI Generated: 2025-08-07 07:04 for Informational use only, not trading advice. Terms and Risk Disclosure Copyright © 2025. Algo Trading Systems LLC.
