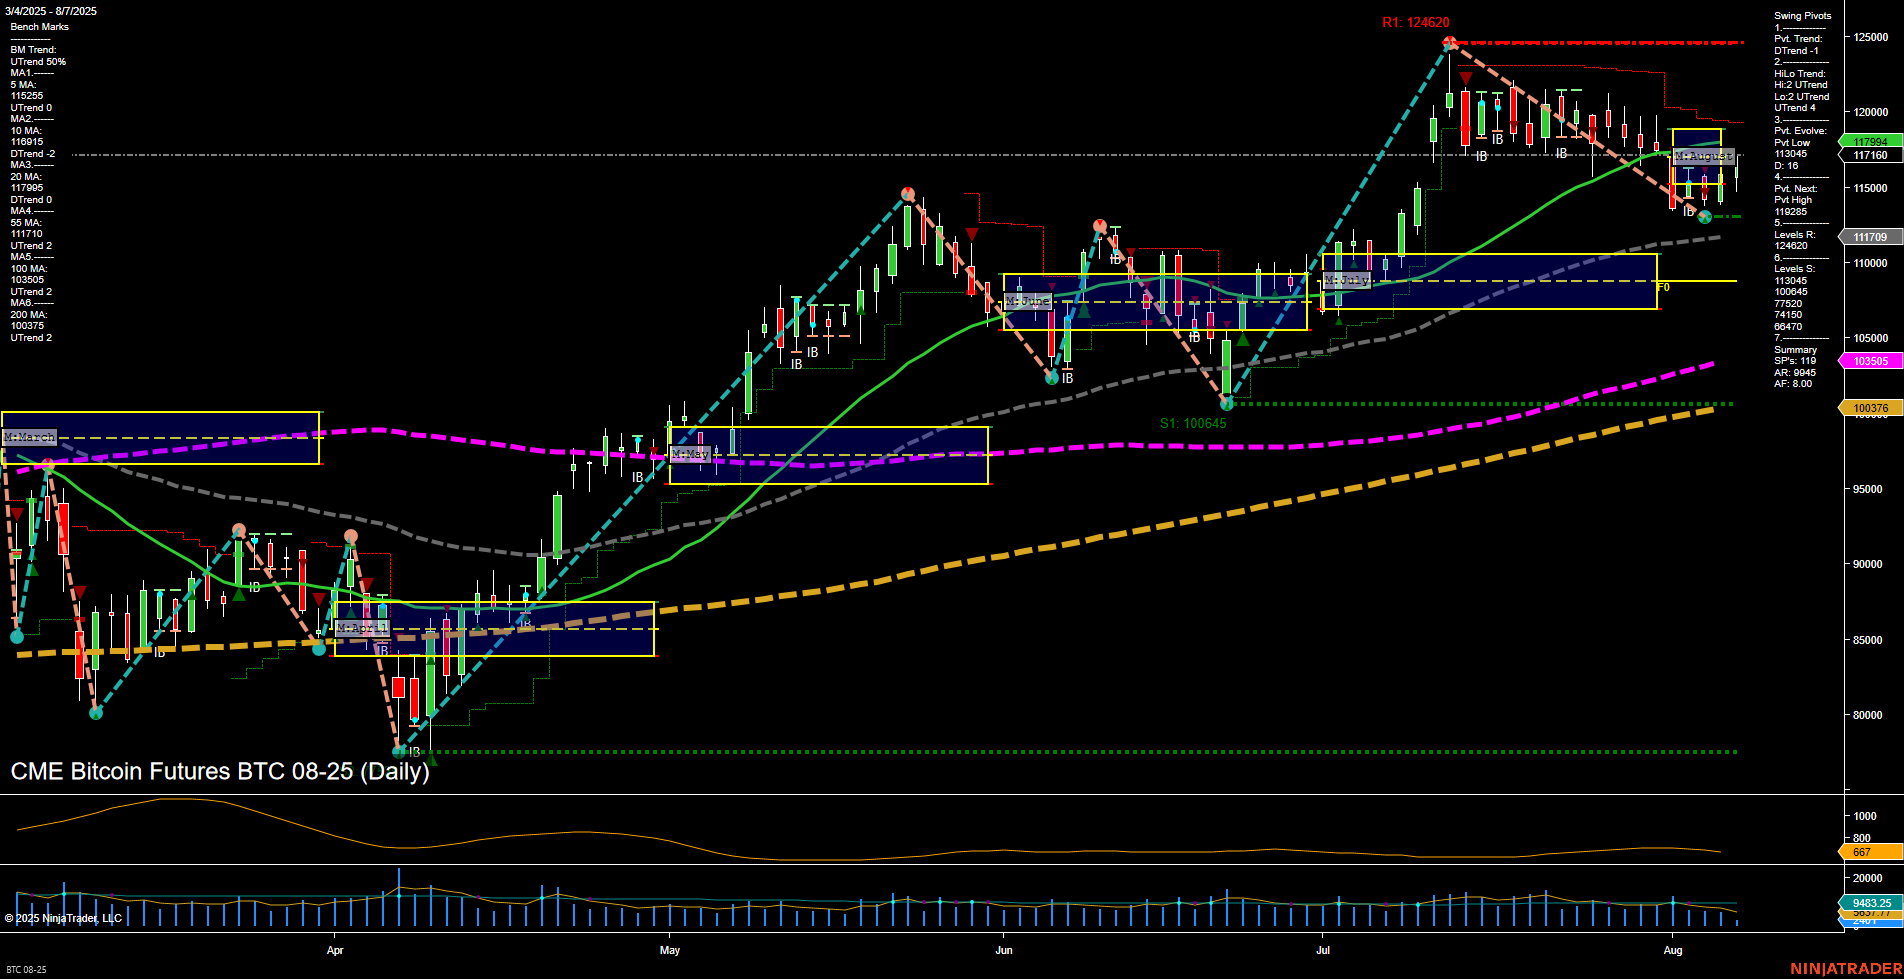
BTC CME Bitcoin Futures Daily Chart Analysis: 2025-Aug-07 07:03 CT
Price Action
- Last: 117994,
- Bars: Medium,
- Mom: Average.
WSFG Weekly
- Short-Term
- WSFG Current: 34%
- F0%/NTZ' Bias: Price Above,
- WSFG Trend: Up.
MSFG Month Aug
- Intermediate-Term
- MSFG Current: 7%
- F0%/NTZ' Bias: Price Above,
- MSFG Trend: Up.
YSFG Year 2025
- Long-Term
- YSFG Current: 70%
- F0%/NTZ' Bias: Price Above,
- YSFG Trend: Up.
Swing Pivots
- (Short-Term) 1. Pvt. Trend: DTrend,
- (Intermediate-Term) 2. HiLo Trend: UTrend,
- 3. Pvt. Evolve: Pvt Low 117166,
- 4. Pvt. Next: Pvt High 120825,
- 5. Levels R: 124620, 120825, 117166,
- 6. Levels S: 114046, 110345, 105055, 100645, 97750, 94670, 89477.
Daily Benchmarks
- (Short-Term) 5 Day: 115265 Up Trend,
- (Short-Term) 10 Day: 116815 Up Trend,
- (Intermediate-Term) 20 Day: 117095 Up Trend,
- (Intermediate-Term) 55 Day: 111709 Up Trend,
- (Long-Term) 100 Day: 103755 Up Trend,
- (Long-Term) 200 Day: 100376 Up Trend.
Additional Metrics
Recent Trade Signals
- 06 Aug 2025: Long BTC 08-25 @ 115775 Signals.USAR-WSFG
- 05 Aug 2025: Short BTC 08-25 @ 113305 Signals.USAR-MSFG
- 05 Aug 2025: Short BTC 08-25 @ 113305 Signals.USAR.TR720
- 31 Jul 2025: Short BTC 08-25 @ 117450 Signals.USAR.TR120
Overall Rating
- Short-Term: Neutral,
- Intermediate-Term: Bullish,
- Long-Term: Bullish.
Key Insights Summary
The current BTC CME futures chart shows a market in transition. Price is holding above all major moving averages, with the 5, 10, 20, 55, 100, and 200-day benchmarks all trending upward, confirming a strong underlying bullish structure. The intermediate and long-term session fib grid trends (MSFG, YSFG) are both up, with price above their respective NTZ/F0% levels, supporting a continuation bias. However, the short-term swing pivot trend has shifted to a downtrend (DTrend), indicating a recent pullback or consolidation phase after a strong rally, as seen by the most recent swing low at 117166 and resistance at 124620.
Recent trade signals reflect this mixed environment, with both long and short entries triggered in the past week, highlighting choppy, two-way action. ATR and volume metrics suggest moderate volatility and participation. The market appears to be digesting gains after a significant move higher, with higher lows and a series of resistance levels overhead. The overall structure favors the bulls on intermediate and long timeframes, but short-term traders may encounter range-bound or corrective price action as the market tests support and resistance zones.
Chart Analysis ATS AI Generated: 2025-08-07 07:03 for Informational use only, not trading advice. Terms and Risk Disclosure Copyright © 2025. Algo Trading Systems LLC.
