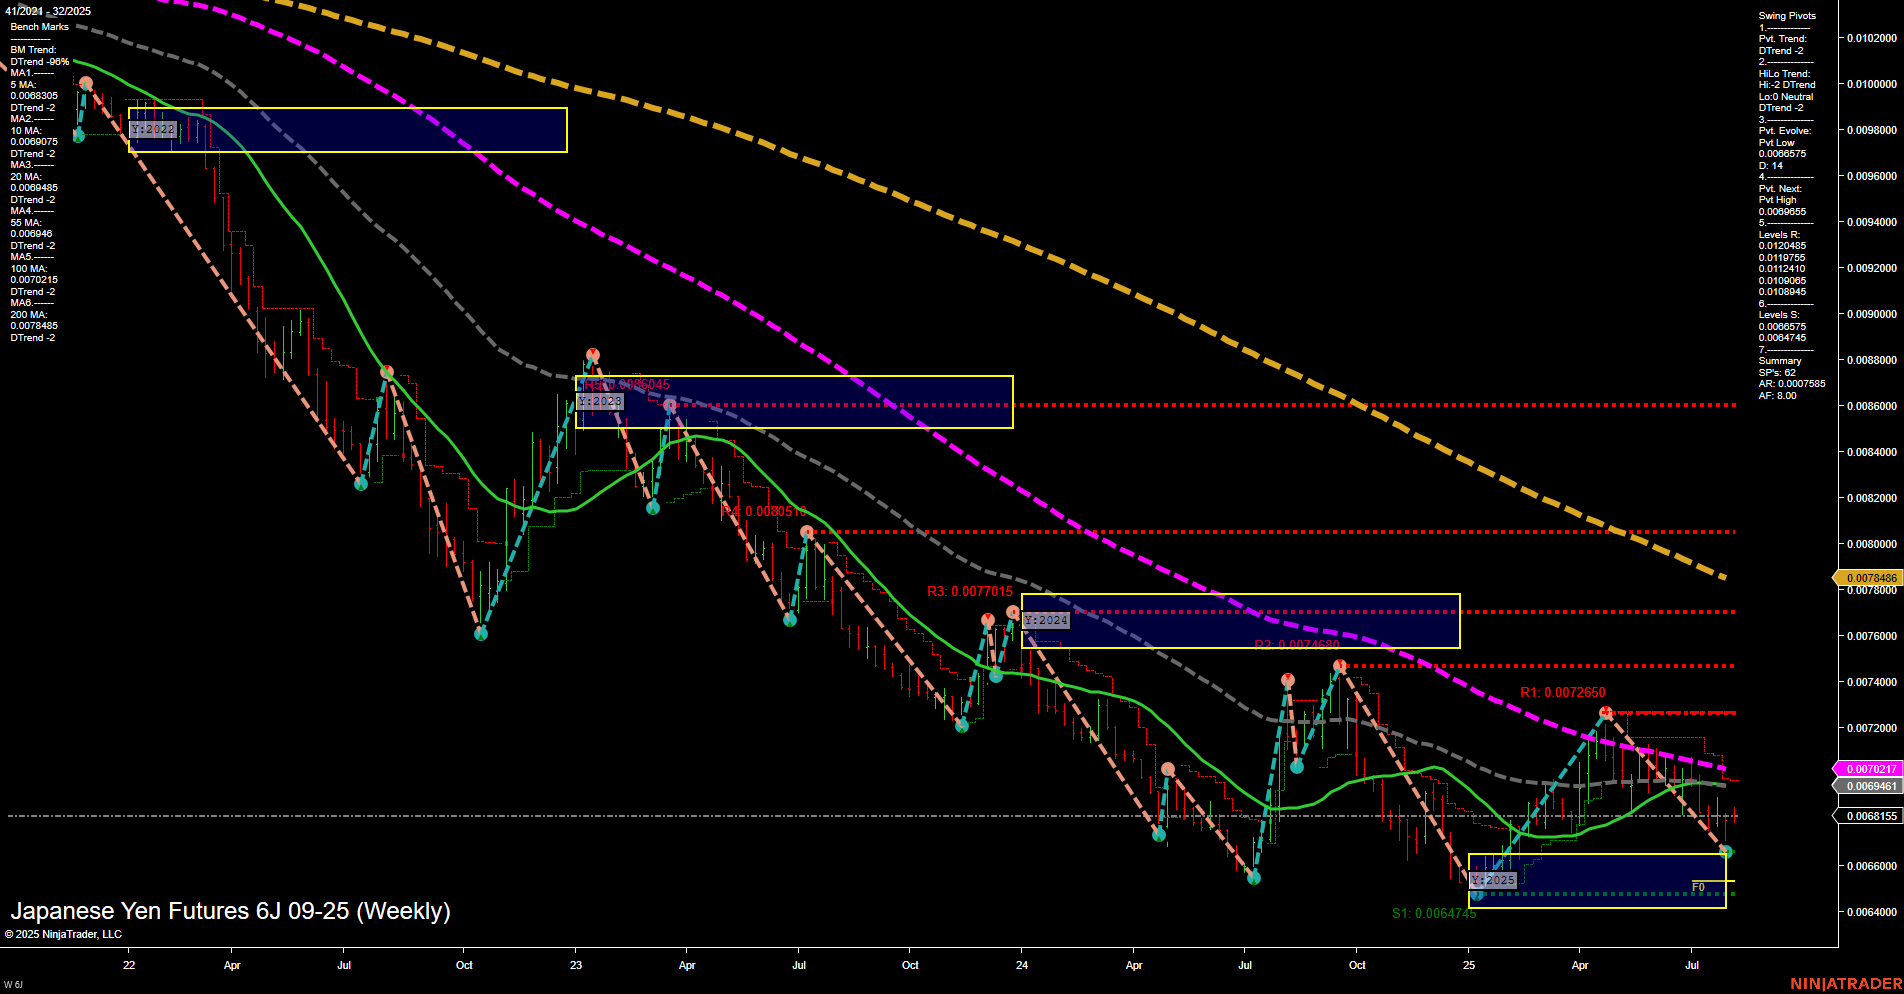
6J Japanese Yen Futures Weekly Chart Analysis: 2025-Aug-07 07:03 CT
Price Action
- Last: 0.00678465,
- Bars: Medium,
- Mom: Momentum slow.
WSFG Weekly
- Short-Term
- WSFG Current: -7%
- F0%/NTZ' Bias: Price Below,
- WSFG Trend: Down.
MSFG Month Aug
- Intermediate-Term
- MSFG Current: 41%
- F0%/NTZ' Bias: Price Above,
- MSFG Trend: Up.
YSFG Year 2025
- Long-Term
- YSFG Current: 24%
- F0%/NTZ' Bias: Price Above,
- YSFG Trend: Up.
Swing Pivots
- (Short-Term) 1. Pvt. Trend: DTrend,
- (Intermediate-Term) 2. HiLo Trend: DTrend,
- 3. Pvt. Evolve: Pvt low 0.0064745,
- 4. Pvt. Next: Pvt high 0.0072650,
- 5. Levels R: 0.0072650, 0.0077015, 0.008045, 0.008305,
- 6. Levels S: 0.0064745, 0.006745.
Weekly Benchmarks
- (Intermediate-Term) 5 Week: 0.0068835 Down Trend,
- (Intermediate-Term) 10 Week: 0.0069461 Down Trend,
- (Long-Term) 20 Week: 0.0070217 Down Trend,
- (Long-Term) 55 Week: 0.0073846 Down Trend,
- (Long-Term) 100 Week: 0.0077017 Down Trend,
- (Long-Term) 200 Week: 0.0088000 Down Trend.
Recent Trade Signals
- 07 Aug 2025: Long 6J 09-25 @ 0.006837 Signals.USAR-WSFG
- 01 Aug 2025: Long 6J 09-25 @ 0.0067865 Signals.USAR.TR120
- 30 Jul 2025: Short 6J 09-25 @ 0.006743 Signals.USAR.TR720
Overall Rating
- Short-Term: Bearish,
- Intermediate-Term: Bearish,
- Long-Term: Bearish.
Key Insights Summary
The 6J Japanese Yen Futures weekly chart shows a market still dominated by a persistent long-term downtrend, as confirmed by all major moving averages (20, 55, 100, and 200 week) trending lower and price trading below these benchmarks. Short-term and intermediate-term swing pivots both indicate a downward trend, with the most recent pivot low at 0.0064745 and resistance levels stacked above, suggesting rallies are being sold into. The WSFG (Weekly Session Fib Grid) trend is down, with price below the NTZ center, reinforcing short-term bearishness. However, the MSFG and YSFG (Monthly and Yearly Session Fib Grids) show price above their respective NTZ centers, hinting at some underlying support or potential for mean reversion, but not enough to shift the overall trend. Recent trade signals show mixed activity, with both long and short entries, reflecting choppy price action and possible attempts at bottoming, but the prevailing structure remains bearish. The market is in a corrective phase within a broader downtrend, with any upside likely to face strong resistance at the highlighted swing levels and moving averages. Volatility remains moderate, and the price structure suggests continued pressure unless a significant breakout above resistance occurs.
Chart Analysis ATS AI Generated: 2025-08-07 07:03 for Informational use only, not trading advice. Terms and Risk Disclosure Copyright © 2025. Algo Trading Systems LLC.
