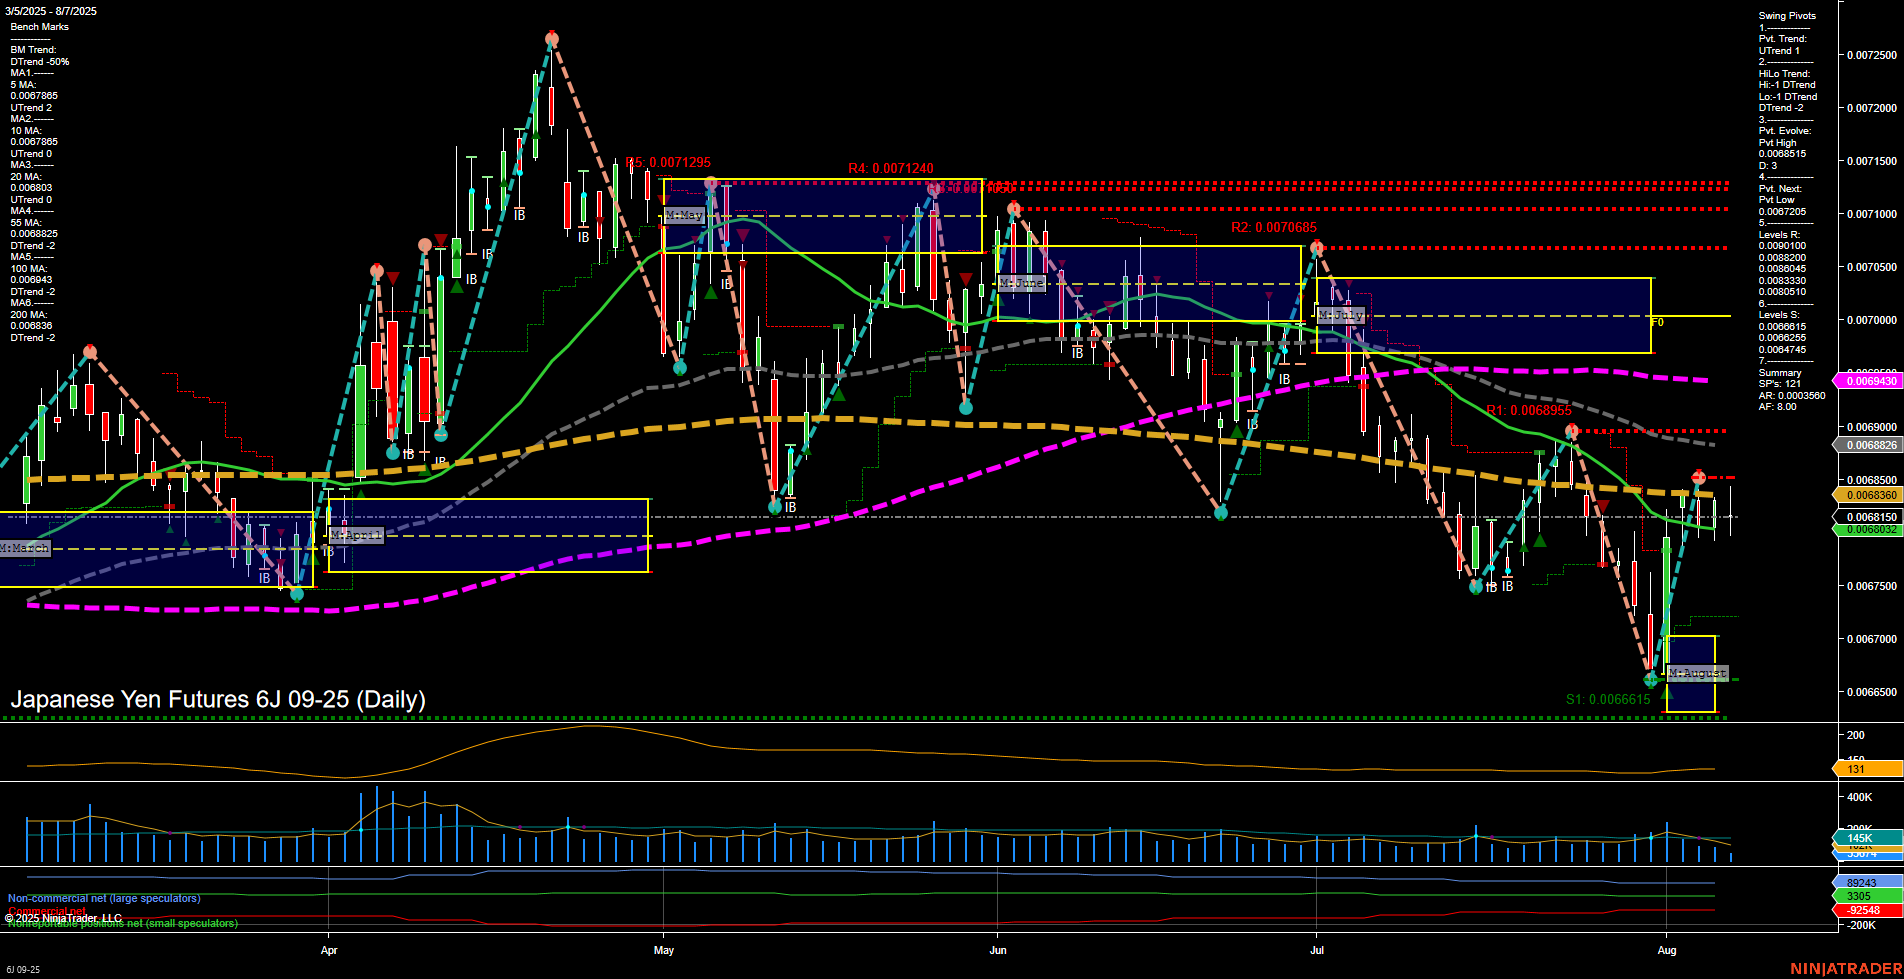
6J Japanese Yen Futures Daily Chart Analysis: 2025-Aug-07 07:02 CT
Price Action
- Last: 0.006892,
- Bars: Medium,
- Mom: Momentum average.
WSFG Weekly
- Short-Term
- WSFG Current: -7%
- F0%/NTZ' Bias: Price Below,
- WSFG Trend: Down.
MSFG Month Aug
- Intermediate-Term
- MSFG Current: 41%
- F0%/NTZ' Bias: Price Above,
- MSFG Trend: Up.
YSFG Year 2025
- Long-Term
- YSFG Current: 24%
- F0%/NTZ' Bias: Price Above,
- YSFG Trend: Up.
Swing Pivots
- (Short-Term) 1. Pvt. Trend: UTrend,
- (Intermediate-Term) 2. HiLo Trend: DTrend,
- 3. Pvt. Evolve: Pvt High 0.0068510,
- 4. Pvt. Next: Pvt Low 0.0066615,
- 5. Levels R: 0.0072205, 0.0071295, 0.0071240, 0.0070685, 0.0069535, 0.0068510,
- 6. Levels S: 0.0066615, 0.0067445, 0.0067475.
Daily Benchmarks
- (Short-Term) 5 Day: 0.0068865 Up Trend,
- (Short-Term) 10 Day: 0.0068803 Up Trend,
- (Intermediate-Term) 20 Day: 0.0068285 Up Trend,
- (Intermediate-Term) 55 Day: 0.0069636 Down Trend,
- (Long-Term) 100 Day: 0.0069543 Down Trend,
- (Long-Term) 200 Day: 0.0068364 Down Trend.
Additional Metrics
Recent Trade Signals
- 07 Aug 2025: Long 6J 09-25 @ 0.006837 Signals.USAR-WSFG
- 01 Aug 2025: Long 6J 09-25 @ 0.0067865 Signals.USAR.TR120
- 30 Jul 2025: Short 6J 09-25 @ 0.006743 Signals.USAR.TR720
Overall Rating
- Short-Term: Bullish,
- Intermediate-Term: Neutral,
- Long-Term: Bullish.
Key Insights Summary
The 6J Japanese Yen futures daily chart shows a recent shift in short-term momentum, with price action rebounding from late July lows and now trading above both the 5-day and 10-day moving averages, confirming a short-term uptrend. The WSFG (weekly) trend remains down, but the MSFG (monthly) and YSFG (yearly) trends are both up, indicating that the broader context is supportive of further gains if the current rally can sustain. Swing pivots highlight a short-term uptrend, but intermediate-term pivots still reflect a downtrend, suggesting the market is in a transition phase. Resistance levels are clustered above, with the nearest at 0.0068510 and 0.0069535, while support is established at 0.0066615. The ATR and VOLMA indicate moderate volatility and healthy participation. Recent trade signals have flipped long, aligning with the short-term bullish bias, but the mixed intermediate-term signals and overhead resistance suggest the market may face consolidation or choppy action before a decisive breakout. Overall, the chart reflects a market attempting to recover within a larger bullish context, but still contending with legacy resistance and the need for confirmation of trend continuation.
Chart Analysis ATS AI Generated: 2025-08-07 07:03 for Informational use only, not trading advice. Terms and Risk Disclosure Copyright © 2025. Algo Trading Systems LLC.
