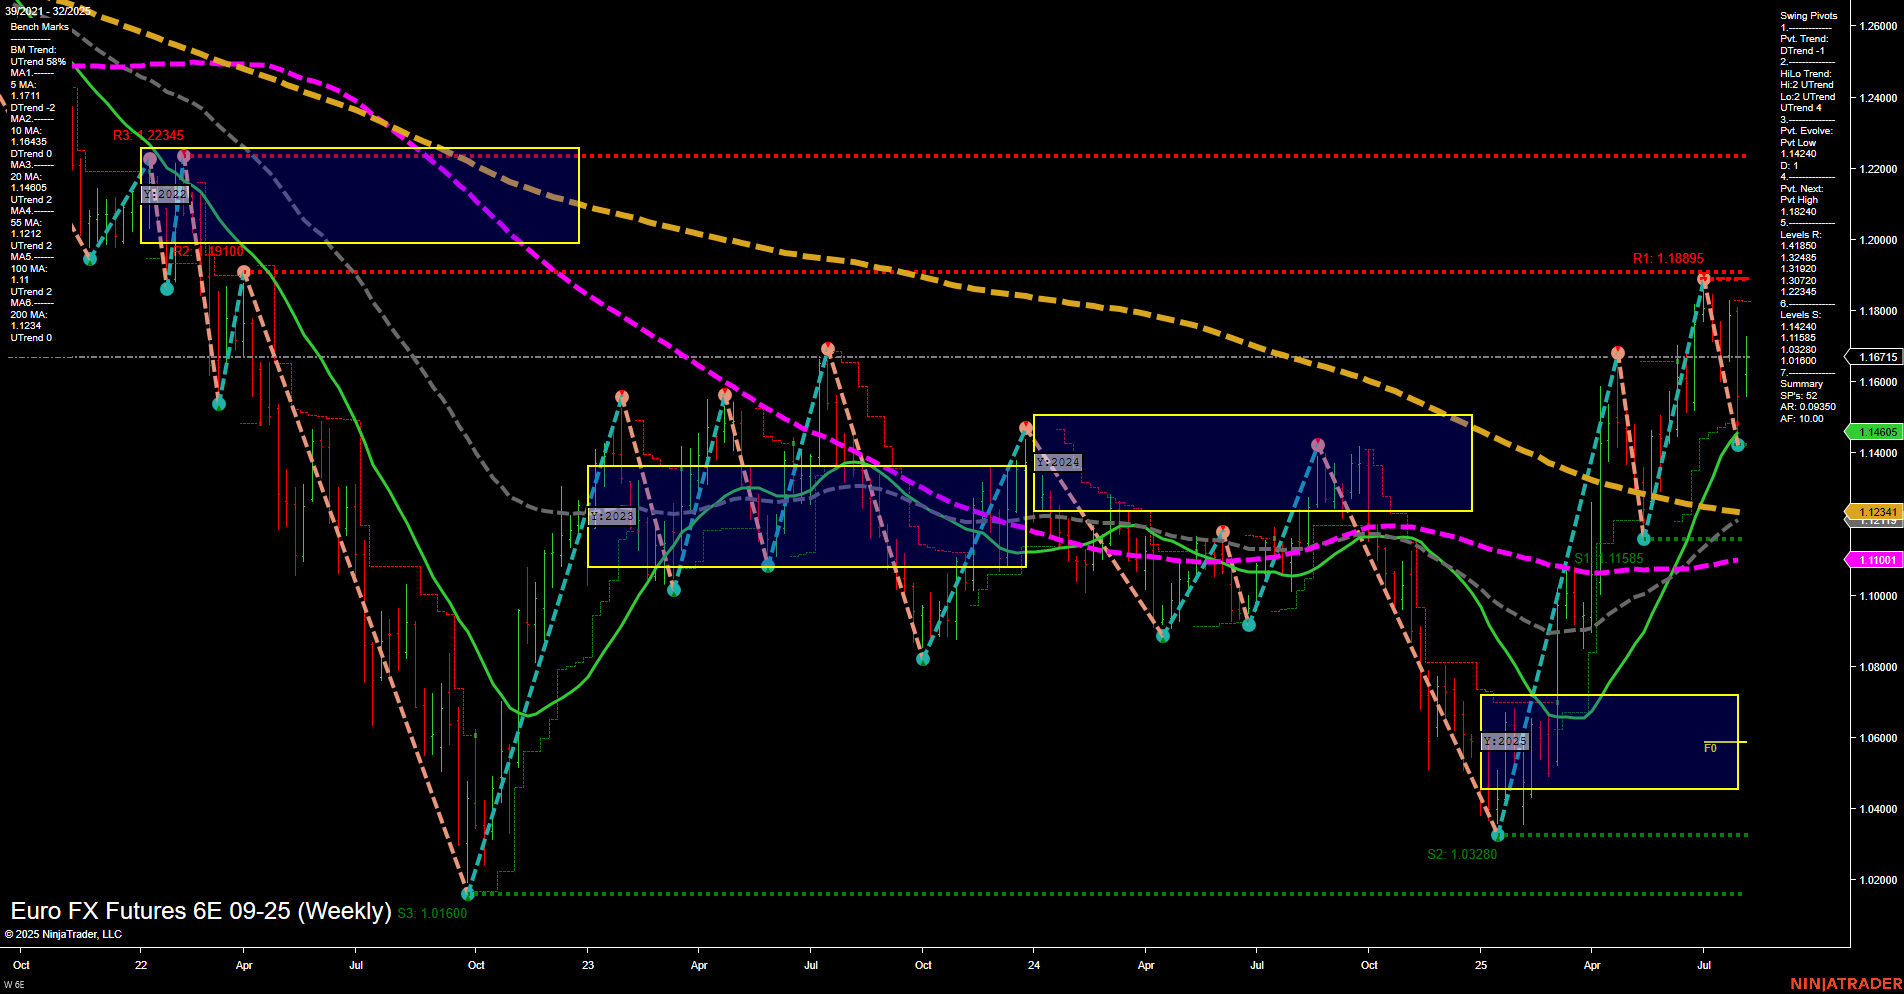
6E Euro FX Futures Weekly Chart Analysis: 2025-Aug-07 07:02 CT
Price Action
- Last: 1.16715,
- Bars: Large,
- Mom: Momentum fast.
WSFG Weekly
- Short-Term
- WSFG Current: 25%
- F0%/NTZ' Bias: Price Above,
- WSFG Trend: Up.
MSFG Month Aug
- Intermediate-Term
- MSFG Current: 47%
- F0%/NTZ' Bias: Price Above,
- MSFG Trend: Up.
YSFG Year 2025
- Long-Term
- YSFG Current: 82%
- F0%/NTZ' Bias: Price Above,
- YSFG Trend: Up.
Swing Pivots
- (Short-Term) 1. Pvt. Trend: UTrend,
- (Intermediate-Term) 2. HiLo Trend: UTrend,
- 3. Pvt. Evolve: Pvt low 1.14240,
- 4. Pvt. Next: Pvt high 1.18895,
- 5. Levels R: 1.22345, 1.19100, 1.18895,
- 6. Levels S: 1.15865, 1.14240, 1.01600.
Weekly Benchmarks
- (Intermediate-Term) 5 Week: 1.16443 Up Trend,
- (Intermediate-Term) 10 Week: 1.14605 Up Trend,
- (Long-Term) 20 Week: 1.12341 Up Trend,
- (Long-Term) 55 Week: 1.11001 Up Trend,
- (Long-Term) 100 Week: 1.12341 Up Trend,
- (Long-Term) 200 Week: 1.19100 Down Trend.
Recent Trade Signals
- 06 Aug 2025: Long 6E 09-25 @ 1.16775 Signals.USAR.TR720
- 06 Aug 2025: Long 6E 09-25 @ 1.16545 Signals.USAR-WSFG
- 01 Aug 2025: Long 6E 09-25 @ 1.1587 Signals.USAR.TR120
Overall Rating
- Short-Term: Bullish,
- Intermediate-Term: Bullish,
- Long-Term: Bullish.
Key Insights Summary
The 6E Euro FX Futures weekly chart is showing strong bullish momentum across all timeframes. Price has broken above key NTZ/F0% levels on the weekly, monthly, and yearly session fib grids, confirming a broad-based uptrend. The most recent swing pivot structure supports this, with both short-term and intermediate-term trends in an uptrend, and the next pivot target is a swing high at 1.18895. Resistance levels are clustered above, but the market has cleared several key moving averages, with all intermediate and long-term benchmarks (except the 200-week) trending upward. Recent trade signals are all long, reflecting the prevailing bullish sentiment. The overall structure suggests a trend continuation environment, with higher lows and higher highs, and the potential for further upside as long as support at 1.15865 and 1.14240 holds. The technical landscape is characterized by strong momentum, trend alignment, and a lack of significant overhead resistance until the 1.18895–1.19100 zone.
Chart Analysis ATS AI Generated: 2025-08-07 07:02 for Informational use only, not trading advice. Terms and Risk Disclosure Copyright © 2025. Algo Trading Systems LLC.
