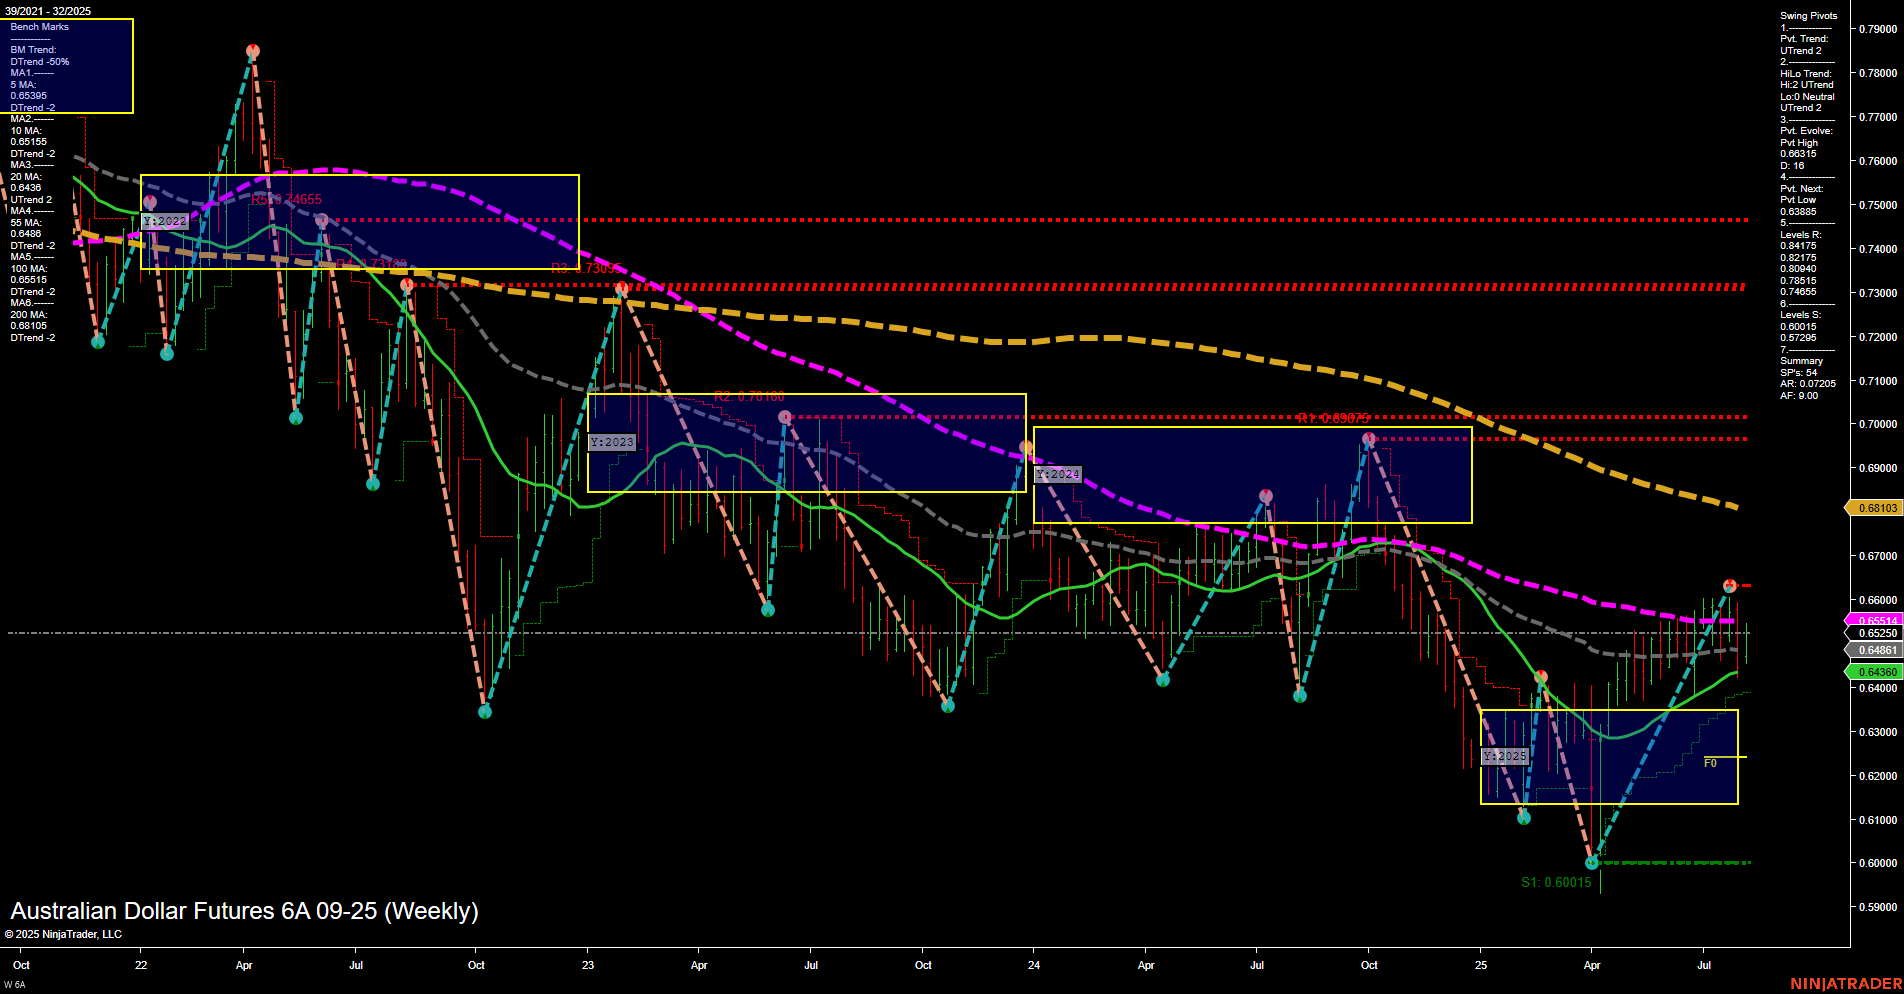
6A Australian Dollar Futures Weekly Chart Analysis: 2025-Aug-07 07:00 CT
Price Action
- Last: 0.65511,
- Bars: Medium,
- Mom: Momentum average.
WSFG Weekly
- Short-Term
- WSFG Current: NA%
- F0%/NTZ' Bias: Price Neutral,
- WSFG Trend: Neutral.
MSFG Month Aug
- Intermediate-Term
- MSFG Current: NA%
- F0%/NTZ' Bias: Price Neutral,
- MSFG Trend: Neutral.
YSFG Year 2025
- Long-Term
- YSFG Current: NA%
- F0%/NTZ' Bias: Price Neutral,
- YSFG Trend: Neutral.
Swing Pivots
- (Short-Term) 1. Pvt. Trend: UTrend,
- (Intermediate-Term) 2. HiLo Trend: UTrend,
- 3. Pvt. Evolve: Pvt high 0.65511,
- 4. Pvt. Next: Pvt low 0.63885,
- 5. Levels R: 0.68103, 0.66975, 0.66015,
- 6. Levels S: 0.63885, 0.63450, 0.60015.
Weekly Benchmarks
- (Intermediate-Term) 5 Week: 0.64681 Up Trend,
- (Intermediate-Term) 10 Week: 0.64580 Up Trend,
- (Long-Term) 20 Week: 0.65250 Up Trend,
- (Long-Term) 55 Week: 0.65511 Down Trend,
- (Long-Term) 100 Week: 0.66154 Down Trend,
- (Long-Term) 200 Week: 0.68103 Down Trend.
Recent Trade Signals
- 06 Aug 2025: Long 6A 09-25 @ 0.65 Signals.USAR-MSFG
- 06 Aug 2025: Long 6A 09-25 @ 0.6498 Signals.USAR-WSFG
Overall Rating
- Short-Term: Bullish,
- Intermediate-Term: Bullish,
- Long-Term: Bearish.
Key Insights Summary
The Australian Dollar Futures (6A) weekly chart shows a recent shift in momentum, with price action moving off the lows and establishing a series of higher lows and higher highs, as indicated by the swing pivot uptrend in both short- and intermediate-term metrics. The last price is trading above the 5, 10, and 20-week moving averages, all of which are in uptrends, supporting the bullish tone in the short and intermediate term. However, the 55, 100, and 200-week moving averages remain in downtrends, highlighting that the broader long-term structure is still bearish and the market is trading below major resistance levels (notably 0.68103 and 0.66154). The recent long trade signals align with the current upward swing, but the price is approaching significant resistance zones, which have previously capped rallies. The overall environment suggests a market in recovery mode, with a potential for further upside in the short to intermediate term, but with long-term headwinds still present. The neutral bias in the session fib grids and the presence of a neutral NTZ zone indicate a lack of strong directional conviction at the highest timeframe, with the market likely to encounter choppy or consolidative conditions as it tests overhead resistance.
Chart Analysis ATS AI Generated: 2025-08-07 07:00 for Informational use only, not trading advice. Terms and Risk Disclosure Copyright © 2025. Algo Trading Systems LLC.
