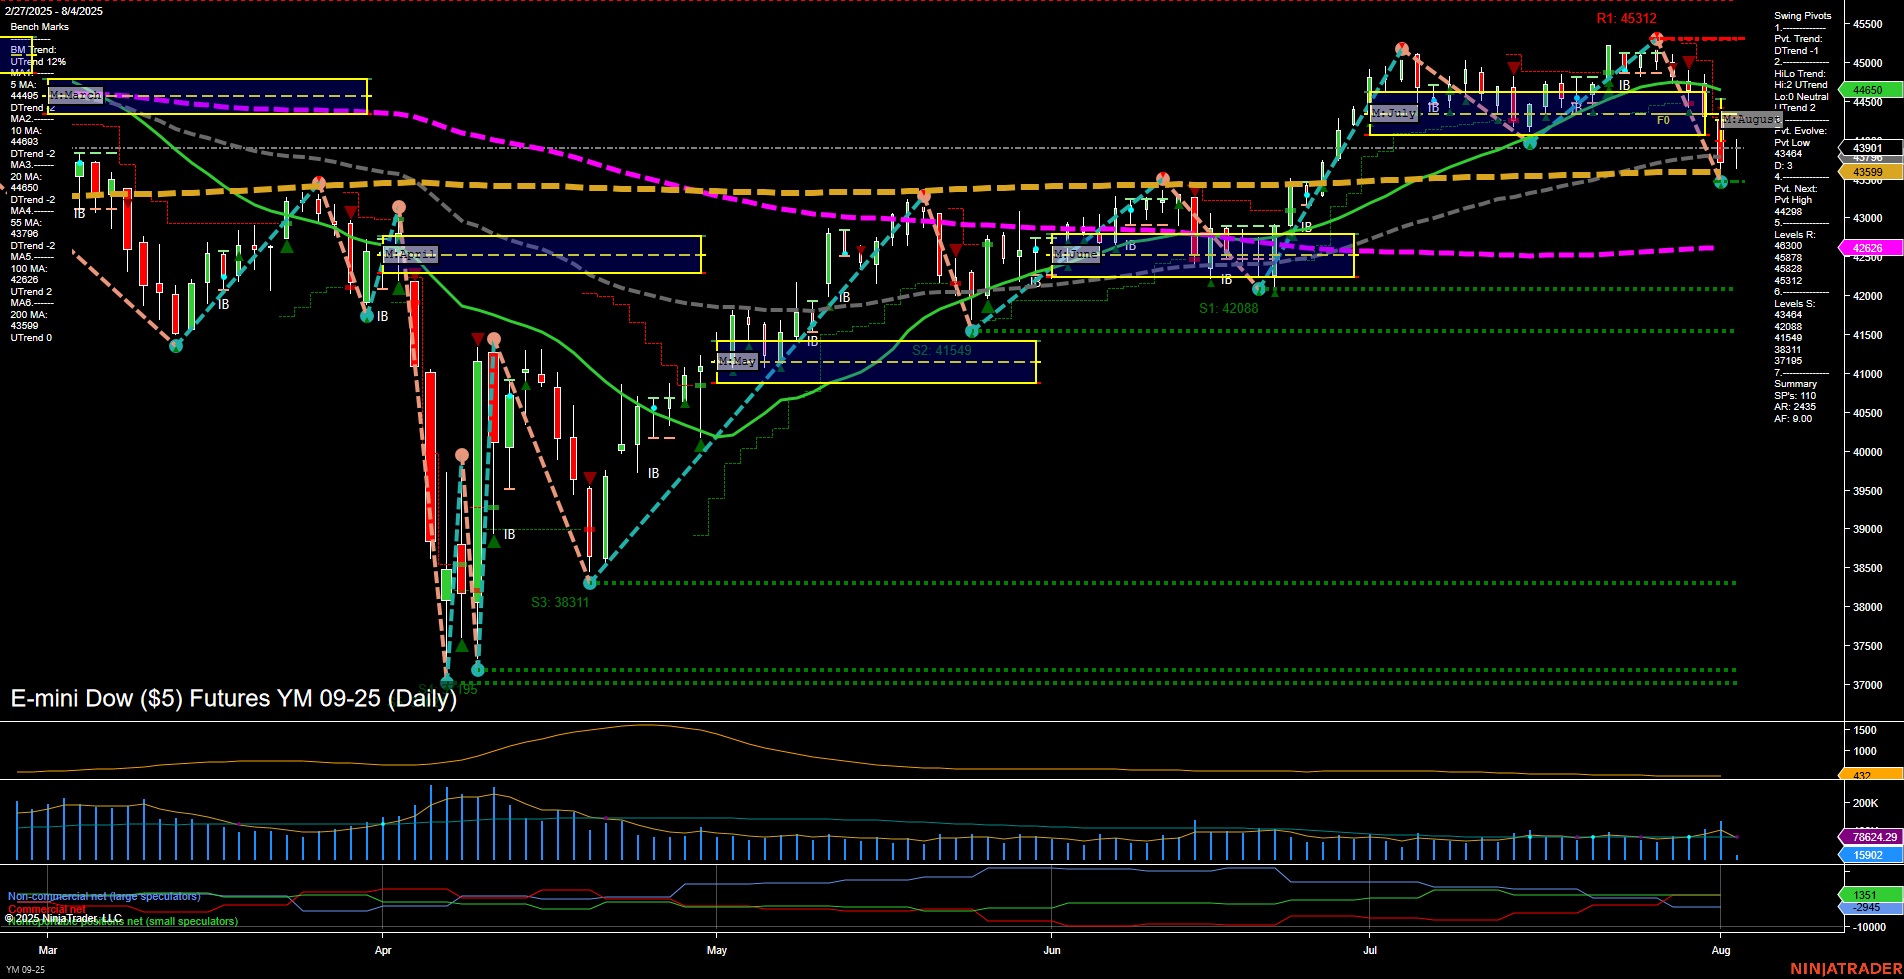
YM E-mini Dow ($5) Futures Daily Chart Analysis: 2025-Aug-04 07:18 CT
Price Action
- Last: 43901,
- Bars: Medium,
- Mom: Momentum slow.
WSFG Weekly
- Short-Term
- WSFG Current: 20%
- F0%/NTZ' Bias: Price Above,
- WSFG Trend: Up.
MSFG Month Aug
- Intermediate-Term
- MSFG Current: -14%
- F0%/NTZ' Bias: Price Below,
- MSFG Trend: Down.
YSFG Year 2025
- Long-Term
- YSFG Current: -1%
- F0%/NTZ' Bias: Price Below,
- YSFG Trend: Down.
Swing Pivots
- (Short-Term) 1. Pvt. Trend: DTrend,
- (Intermediate-Term) 2. HiLo Trend: DTrend,
- 3. Pvt. Evolve: Pvt Low 43901,
- 4. Pvt. Next: Pvt High 44268,
- 5. Levels R: 45312, 45070, 44680, 44512,
- 6. Levels S: 42088, 41549, 38311.
Daily Benchmarks
- (Short-Term) 5 Day: 44465 Down Trend,
- (Short-Term) 10 Day: 44603 Down Trend,
- (Intermediate-Term) 20 Day: 44550 Neutral,
- (Intermediate-Term) 55 Day: 43626 Up Trend,
- (Long-Term) 100 Day: 43266 Up Trend,
- (Long-Term) 200 Day: 42626 Up Trend.
Additional Metrics
Recent Trade Signals
- 04 Aug 2025: Short YM 09-25 @ 43894 Signals.USAR-MSFG
- 01 Aug 2025: Short YM 09-25 @ 44238 Signals.USAR.TR720
- 29 Jul 2025: Short YM 09-25 @ 45069 Signals.USAR-WSFG
- 28 Jul 2025: Short YM 09-25 @ 44957 Signals.USAR.TR120
Overall Rating
- Short-Term: Bearish,
- Intermediate-Term: Bearish,
- Long-Term: Bearish.
Key Insights Summary
The YM E-mini Dow futures are currently experiencing a notable shift in sentiment, with all major timeframes (short, intermediate, and long-term) reflecting a bearish bias. Price action has recently broken below key monthly and yearly session fib grid levels, and the momentum is slow, indicating a lack of strong buying interest. The swing pivot structure confirms a short-term and intermediate-term downtrend, with the most recent pivot low established at 43901 and resistance levels stacked above in the 44500–45300 range. Daily benchmarks show short-term moving averages trending down, while intermediate and long-term averages remain upward but are flattening, suggesting a possible transition phase. Recent trade signals have consistently triggered short entries, reinforcing the prevailing downside pressure. Volatility, as measured by ATR, is moderate, and volume remains robust, indicating active participation during this move. The market appears to be in a corrective phase following a failed attempt to sustain higher levels, with lower highs and a test of support zones. The technical landscape suggests continued caution as the market seeks to establish a new base or potentially extend the current downtrend.
Chart Analysis ATS AI Generated: 2025-08-04 07:18 for Informational use only, not trading advice. Terms and Risk Disclosure Copyright © 2025. Algo Trading Systems LLC.
