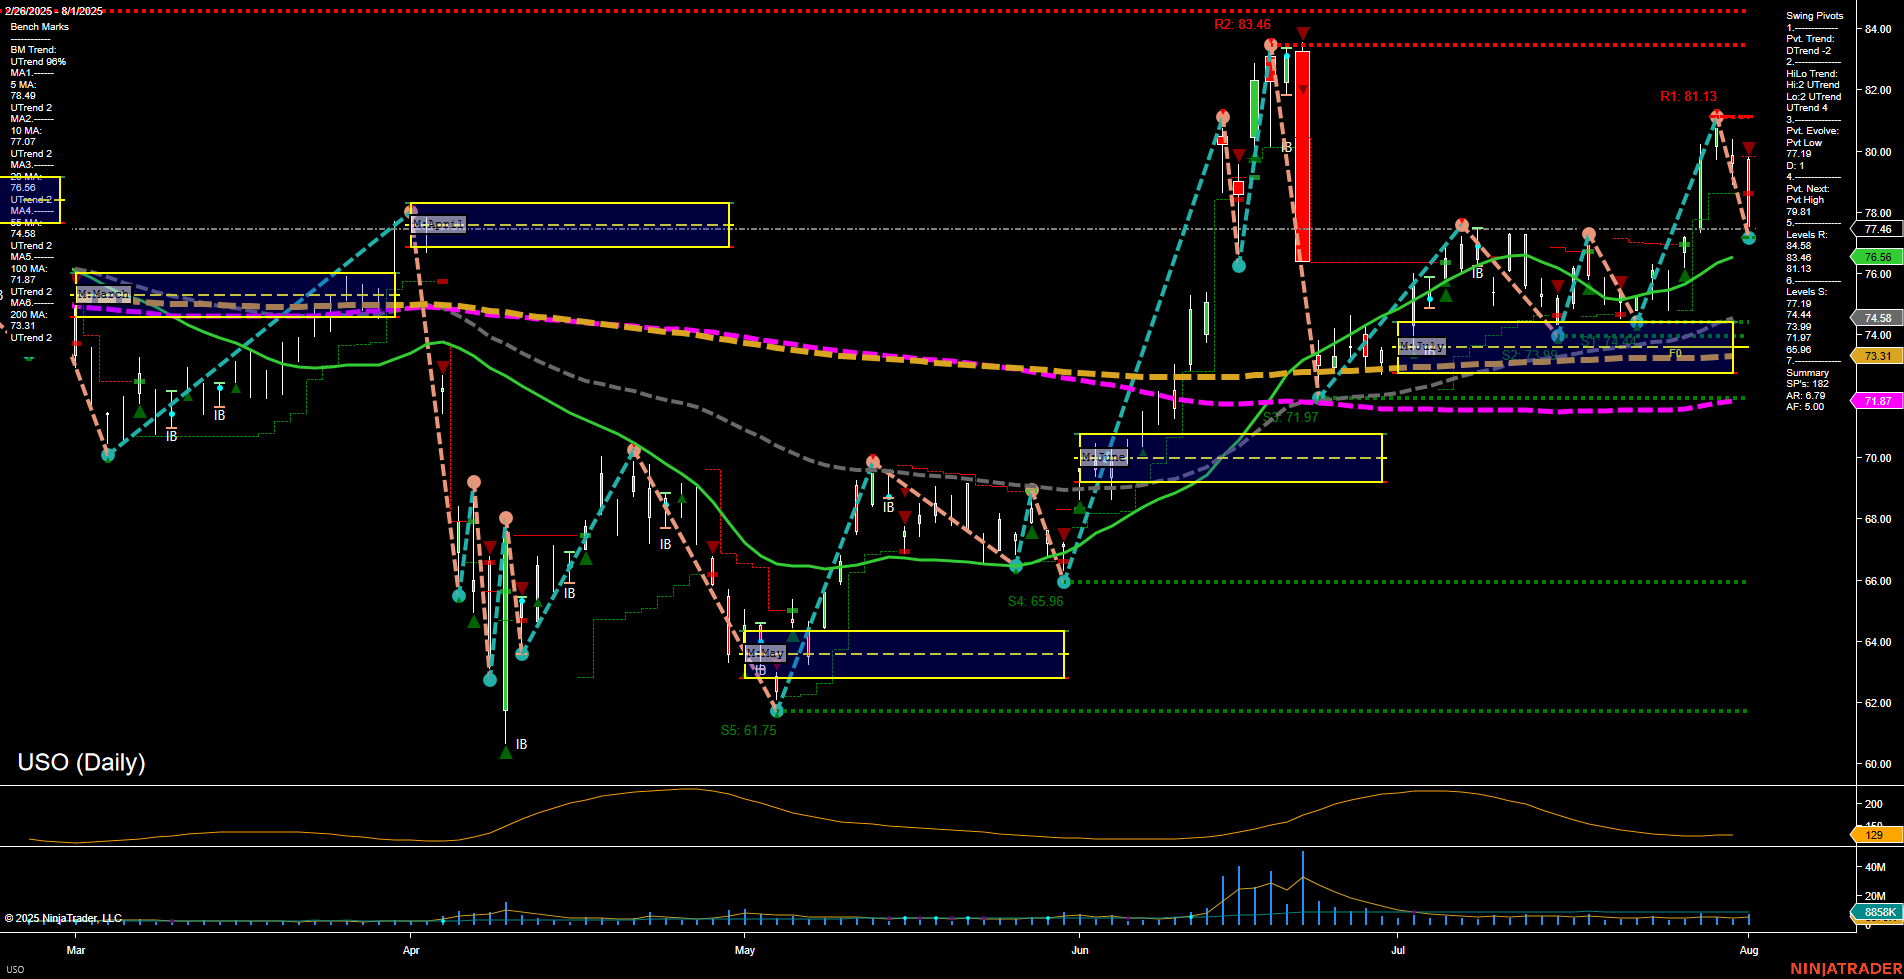
USO United States Oil Fund LP Daily Chart Analysis: 2025-Aug-04 07:17 CT
Price Action
- Last: 77.46,
- Bars: Medium,
- Mom: Average.
WSFG Weekly
- Short-Term
- WSFG Current: NA%
- F0%/NTZ' Bias: Price Neutral,
- WSFG Trend: Neutral.
MSFG Month Aug
- Intermediate-Term
- MSFG Current: NA%
- F0%/NTZ' Bias: Price Neutral,
- MSFG Trend: Neutral.
YSFG Year 2025
- Long-Term
- YSFG Current: NA%
- F0%/NTZ' Bias: Price Neutral,
- YSFG Trend: Neutral.
Swing Pivots
- (Short-Term) 1. Pvt. Trend: DTrend,
- (Intermediate-Term) 2. HiLo Trend: UTrend,
- 3. Pvt. Evolve: Pvt low 77.19,
- 4. Pvt. Next: Pvt high 78.81,
- 5. Levels R: 83.46, 81.13, 78.81,
- 6. Levels S: 77.19, 74.58, 71.97, 65.96, 61.75.
Daily Benchmarks
- (Short-Term) 5 Day: 77.07 Down Trend,
- (Short-Term) 10 Day: 77.46 Down Trend,
- (Intermediate-Term) 20 Day: 76.56 Up Trend,
- (Intermediate-Term) 55 Day: 74.58 Up Trend,
- (Long-Term) 100 Day: 73.31 Up Trend,
- (Long-Term) 200 Day: 71.87 Up Trend.
Additional Metrics
- ATR: 138,
- VOLMA: 2,577,640.
Overall Rating
- Short-Term: Neutral,
- Intermediate-Term: Bullish,
- Long-Term: Bullish.
Key Insights Summary
USO is currently consolidating after a strong rally in June and July, with price action now retracing from recent swing highs near 81.13 and 83.46. The short-term swing pivot trend has shifted to a downtrend, but the intermediate-term HiLo trend remains up, supported by rising 20, 55, 100, and 200-day moving averages. The 5 and 10-day MAs are in a short-term downtrend, reflecting the recent pullback, but the overall structure remains constructive above key support at 77.19 and 74.58. Volatility (ATR) is elevated, and volume has normalized after a spike during the June breakout. The market is in a neutral-to-bullish posture, with the potential for further consolidation or a retest of support before any renewed upside momentum. No clear breakout or breakdown is present, and the price is trading within a well-defined range between major resistance and support levels.
Chart Analysis ATS AI Generated: 2025-08-04 07:17 for Informational use only, not trading advice. Terms and Risk Disclosure Copyright © 2025. Algo Trading Systems LLC.
