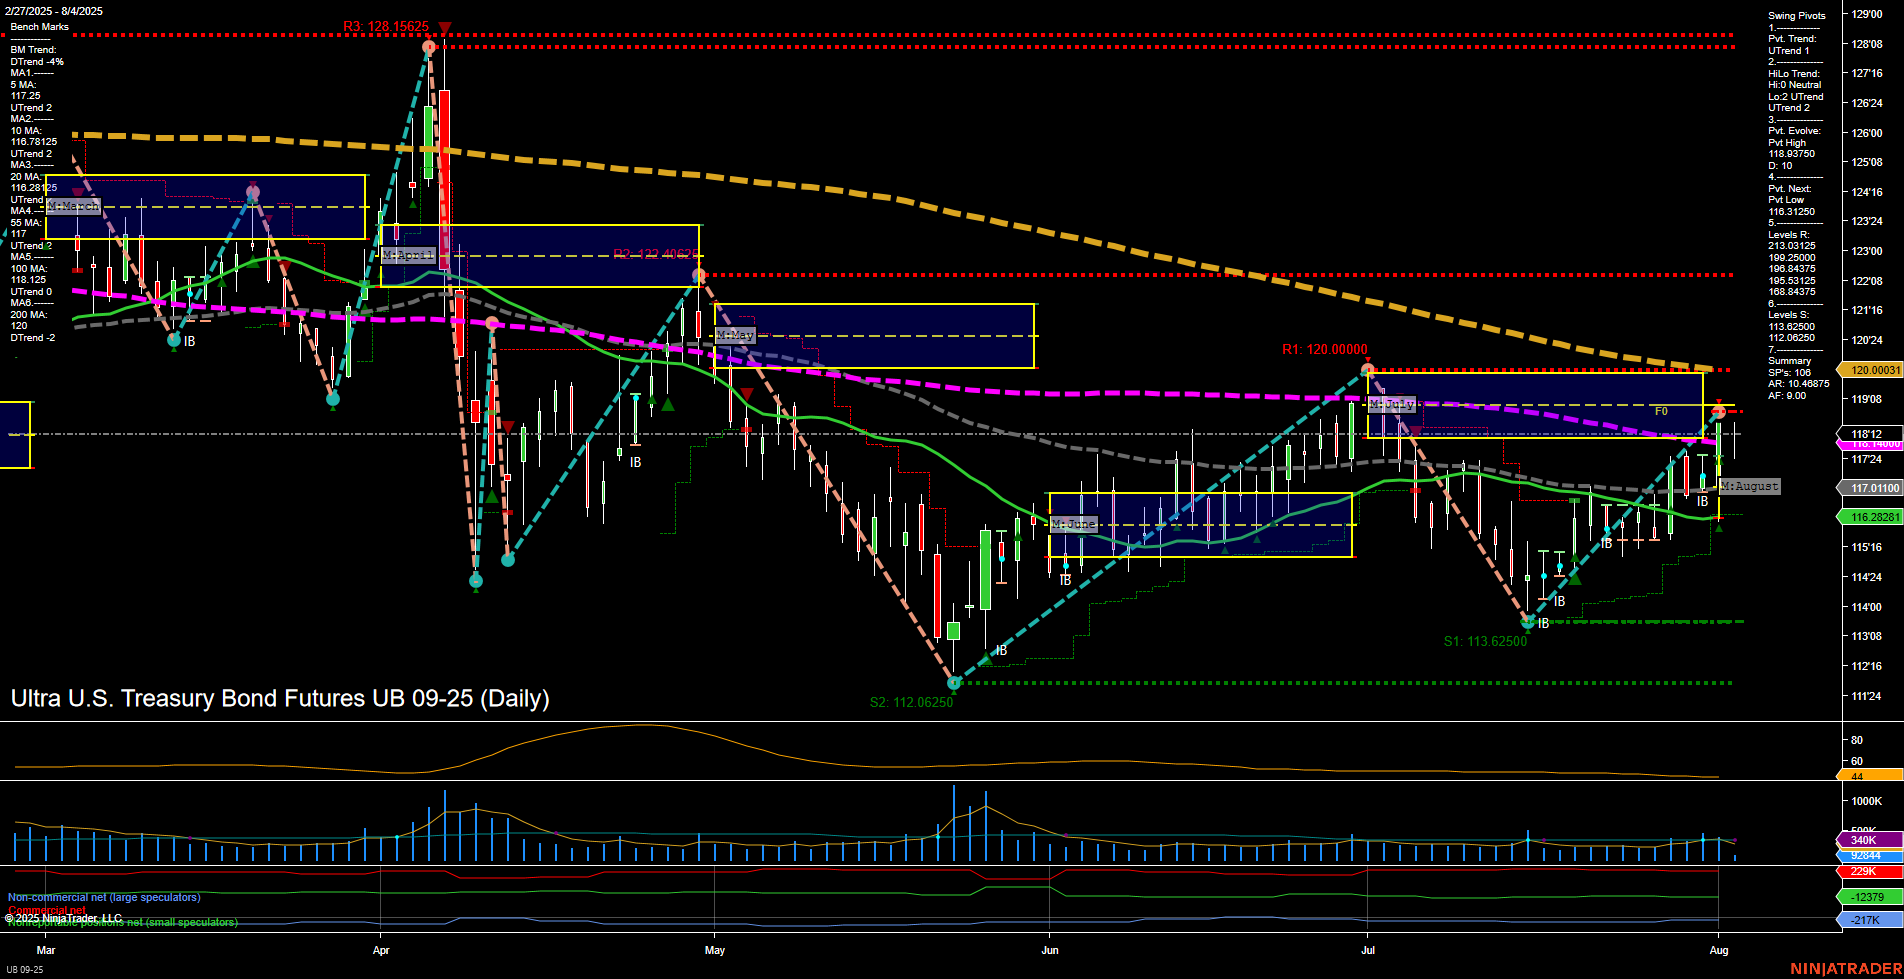
UB Ultra U.S. Treasury Bond Futures Daily Chart Analysis: 2025-Aug-04 07:16 CT
Price Action
- Last: 117.0110,
- Bars: Medium,
- Mom: Average.
WSFG Weekly
- Short-Term
- WSFG Current: -5%
- F0%/NTZ' Bias: Price Below,
- WSFG Trend: Down.
MSFG Month Aug
- Intermediate-Term
- MSFG Current: 17%
- F0%/NTZ' Bias: Price Above,
- MSFG Trend: Up.
YSFG Year 2025
- Long-Term
- YSFG Current: 1%
- F0%/NTZ' Bias: Price Above,
- YSFG Trend: Up.
Swing Pivots
- (Short-Term) 1. Pvt. Trend: UTrend,
- (Intermediate-Term) 2. HiLo Trend: UTrend,
- 3. Pvt. Evolve: Pvt High 116.9910,
- 4. Pvt. Next: Pvt Low 116.3125,
- 5. Levels R: 128.1562, 120.4484, 120.0000, 119.2031, 118.3437, 116.9910,
- 6. Levels S: 116.3125, 113.6250.
Daily Benchmarks
- (Short-Term) 5 Day: 117.6250 Up Trend,
- (Short-Term) 10 Day: 116.7812 Up Trend,
- (Intermediate-Term) 20 Day: 116.2628 Up Trend,
- (Intermediate-Term) 55 Day: 117.0110 Down Trend,
- (Long-Term) 100 Day: 118.2812 Down Trend,
- (Long-Term) 200 Day: 120.0003 Down Trend.
Additional Metrics
Recent Trade Signals
- 04 Aug 2025: Long UB 09-25 @ 117.90625 Signals.USAR-MSFG
- 04 Aug 2025: Short UB 09-25 @ 117.96875 Signals.USAR-WSFG
- 30 Jul 2025: Long UB 09-25 @ 117.71875 Signals.USAR.TR720
- 28 Jul 2025: Long UB 09-25 @ 116.59375 Signals.USAR.TR120
Overall Rating
- Short-Term: Neutral,
- Intermediate-Term: Bullish,
- Long-Term: Neutral.
Key Insights Summary
The UB Ultra U.S. Treasury Bond Futures daily chart shows a market in transition. Short-term price action is mixed, with medium-sized bars and average momentum, while the weekly session fib grid (WSFG) trend is down and price is below the NTZ, indicating short-term pressure. However, both the monthly (MSFG) and yearly (YSFG) session fib grids show price above their respective NTZs and an upward trend, suggesting intermediate and long-term bullishness. Swing pivots confirm an uptrend in both short- and intermediate-term, with the most recent pivot high at 116.9910 and next potential support at 116.3125. Benchmark moving averages are split: short-term MAs are trending up, but intermediate and long-term MAs remain in a downtrend, reflecting a market that is attempting to reverse but still faces overhead resistance. ATR and volume metrics indicate moderate volatility and participation. Recent trade signals highlight both long and short entries, reflecting the current choppy and indecisive environment. Overall, the market is consolidating after a recent rally, with potential for further upside if intermediate-term momentum persists, but short-term resistance and mixed signals suggest caution as the market tests key levels.
Chart Analysis ATS AI Generated: 2025-08-04 07:17 for Informational use only, not trading advice. Terms and Risk Disclosure Copyright © 2025. Algo Trading Systems LLC.
