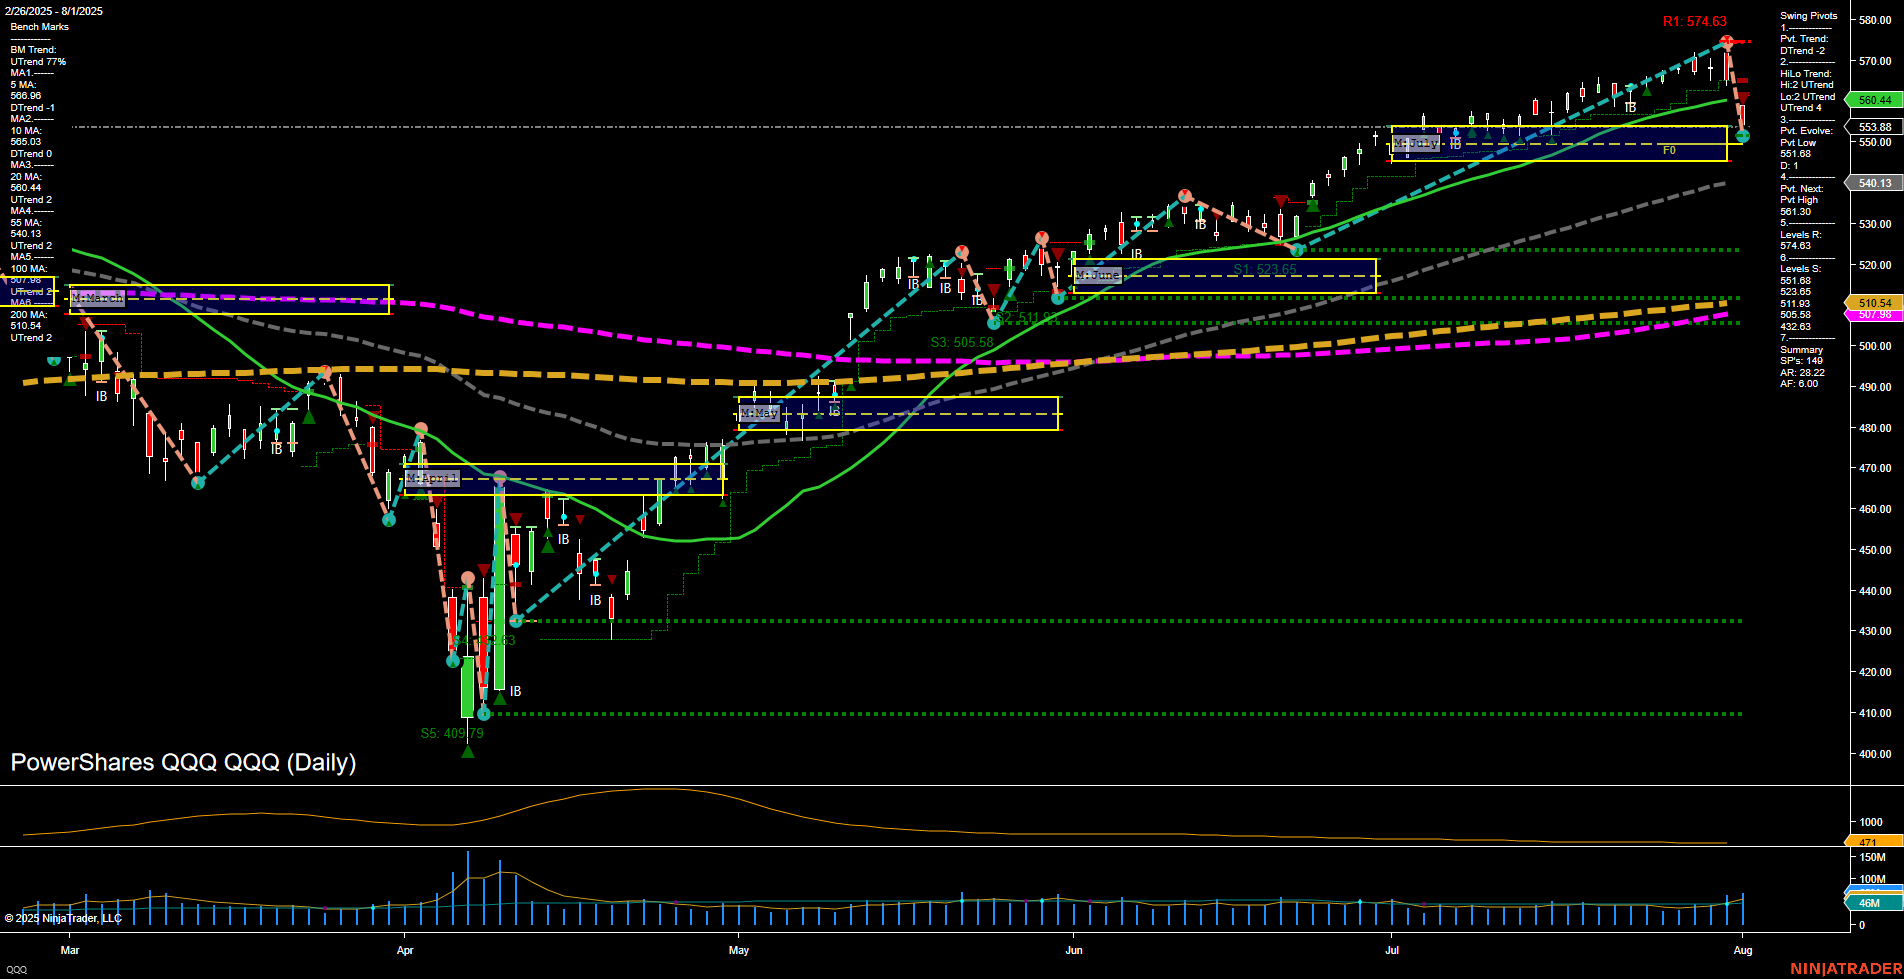
QQQ PowerShares QQQ Daily Chart Analysis: 2025-Aug-04 07:12 CT
Price Action
- Last: 553.88,
- Bars: Large,
- Mom: Momentum fast.
WSFG Weekly
- Short-Term
- WSFG Current: NA%
- F0%/NTZ' Bias: Price Neutral,
- WSFG Trend: Neutral.
MSFG Month Aug
- Intermediate-Term
- MSFG Current: NA%
- F0%/NTZ' Bias: Price Neutral,
- MSFG Trend: Neutral.
YSFG Year 2025
- Long-Term
- YSFG Current: NA%
- F0%/NTZ' Bias: Price Neutral,
- YSFG Trend: Neutral.
Swing Pivots
- (Short-Term) 1. Pvt. Trend: DTrend,
- (Intermediate-Term) 2. HiLo Trend: UTrend,
- 3. Pvt. Evolve: Pvt Low 551.08,
- 4. Pvt. Next: Pvt High 574.63,
- 5. Levels R: 574.63, 561.30, 547.63,
- 6. Levels S: 551.08, 523.65, 510.54.
Daily Benchmarks
- (Short-Term) 5 Day: 566.08 Down Trend,
- (Short-Term) 10 Day: 565.03 Down Trend,
- (Intermediate-Term) 20 Day: 560.44 Down Trend,
- (Intermediate-Term) 55 Day: 540.13 Up Trend,
- (Long-Term) 100 Day: 526.04 Up Trend,
- (Long-Term) 200 Day: 510.54 Up Trend.
Additional Metrics
- ATR: 733,
- VOLMA: 32709273.
Overall Rating
- Short-Term: Bearish,
- Intermediate-Term: Neutral,
- Long-Term: Bullish.
Key Insights Summary
The QQQ daily chart shows a sharp recent pullback, with large bars and fast momentum to the downside, breaking below short-term moving averages (5, 10, 20-day), all of which have turned down. The short-term swing pivot trend has shifted to a downtrend, while the intermediate-term HiLo trend remains up, indicating a possible corrective phase within a larger uptrend. Key resistance is at 574.63 and 561.30, with immediate support at 551.08 and further below at 523.65 and 510.54. The 55, 100, and 200-day moving averages are still trending up, supporting a bullish long-term structure. ATR is elevated, and volume is above average, suggesting heightened volatility and active participation. The overall structure points to a short-term bearish/corrective move within a longer-term bullish trend, with the market currently testing key support levels after a strong rally.
Chart Analysis ATS AI Generated: 2025-08-04 07:12 for Informational use only, not trading advice. Terms and Risk Disclosure Copyright © 2025. Algo Trading Systems LLC.
