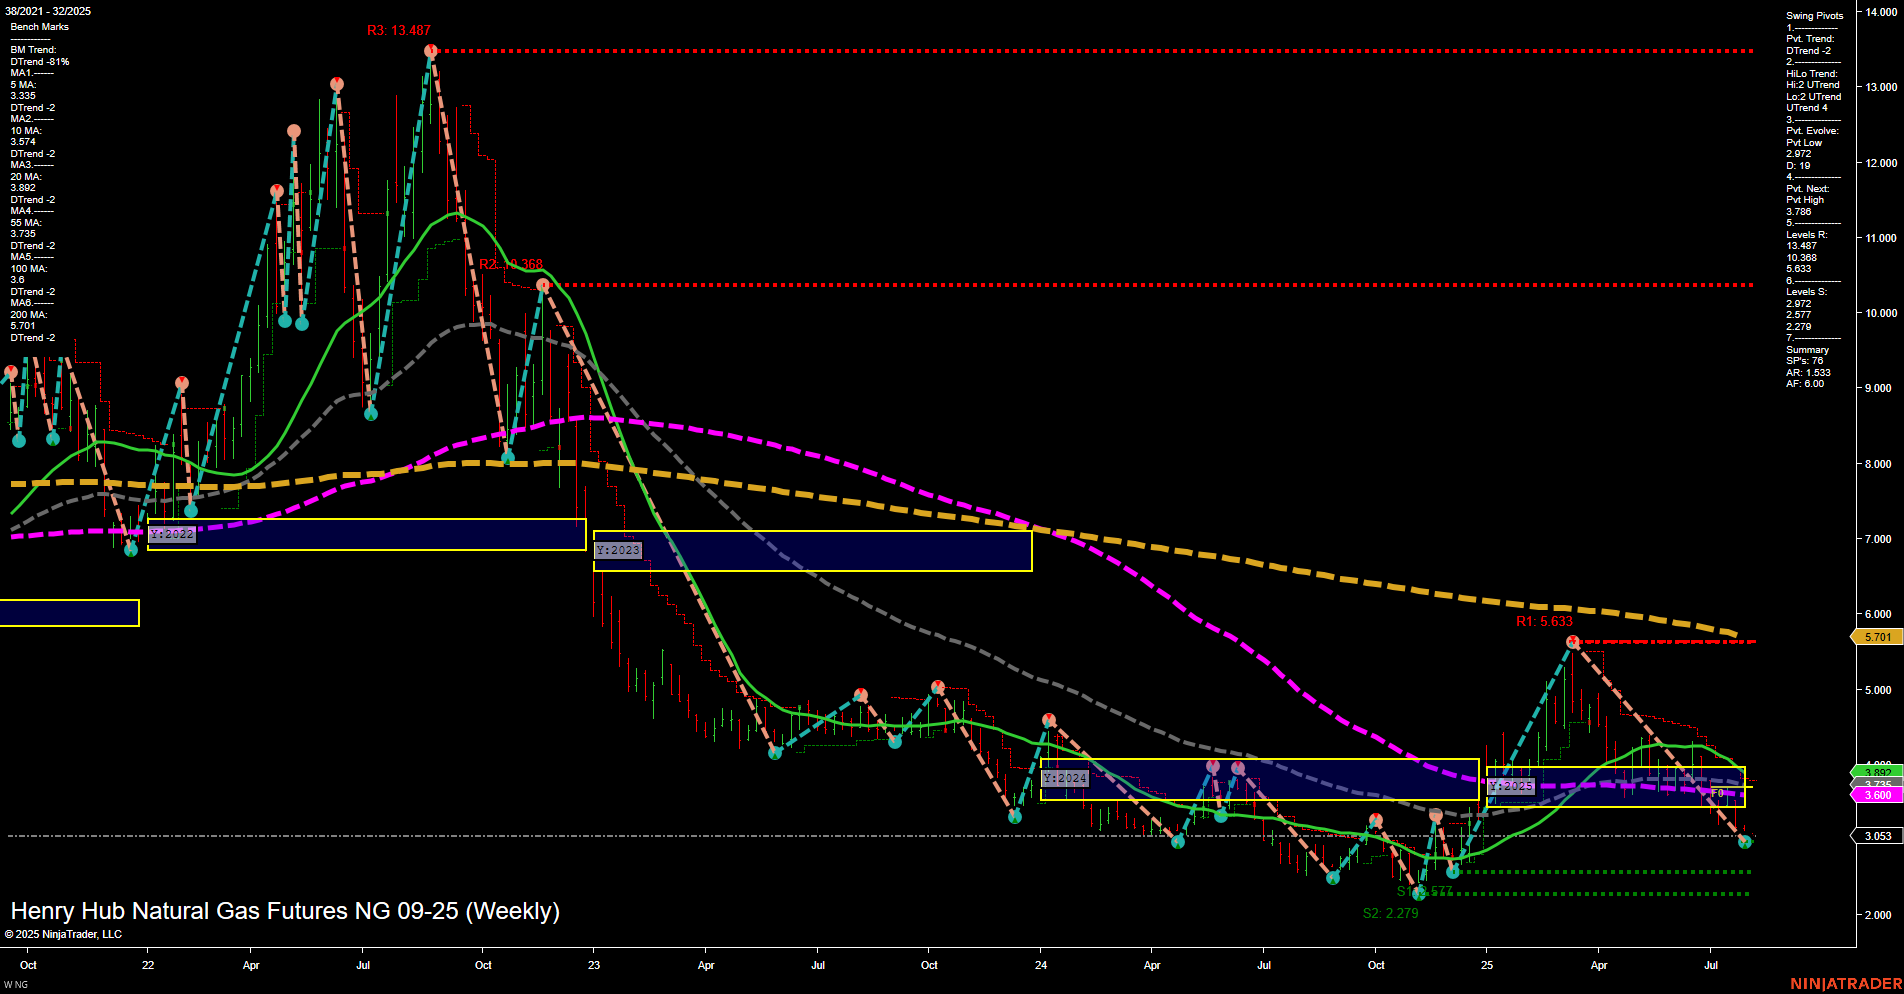
NG Henry Hub Natural Gas Futures Weekly Chart Analysis: 2025-Aug-04 07:10 CT
Price Action
- Last: 3.053,
- Bars: Medium,
- Mom: Momentum slow.
WSFG Weekly
- Short-Term
- WSFG Current: NA%
- F0%/NTZ' Bias: Price Neutral,
- WSFG Trend: Neutral.
MSFG Month Aug
- Intermediate-Term
- MSFG Current: NA%
- F0%/NTZ' Bias: Price Neutral,
- MSFG Trend: Neutral.
YSFG Year 2025
- Long-Term
- YSFG Current: NA%
- F0%/NTZ' Bias: Price Neutral,
- YSFG Trend: Neutral.
Swing Pivots
- (Short-Term) 1. Pvt. Trend: DTrend,
- (Intermediate-Term) 2. HiLo Trend: UTrend,
- 3. Pvt. Evolve: Pvt low 2.172,
- 4. Pvt. Next: Pvt high 3.748,
- 5. Levels R: 13.487, 10.338, 6.633, 5.633,
- 6. Levels S: 2.279, 2.172.
Weekly Benchmarks
- (Intermediate-Term) 5 Week: 3.335 Down Trend,
- (Intermediate-Term) 10 Week: 3.174 Down Trend,
- (Long-Term) 20 Week: 3.600 Down Trend,
- (Long-Term) 55 Week: 4.792 Down Trend,
- (Long-Term) 100 Week: 5.545 Down Trend,
- (Long-Term) 200 Week: 5.701 Down Trend.
Overall Rating
- Short-Term: Bearish,
- Intermediate-Term: Neutral,
- Long-Term: Bearish.
Key Insights Summary
The weekly chart for NG Henry Hub Natural Gas Futures shows a market that remains under significant long-term pressure. Price action is subdued, with medium-sized bars and slow momentum, reflecting a lack of strong directional conviction. The short-term swing pivot trend is down, and all key moving averages (from 5-week to 200-week) are trending lower, reinforcing a bearish long-term structure. However, the intermediate-term HiLo trend is up, suggesting some recent attempts at recovery or countertrend rallies, but these have not been strong enough to shift the broader trend. Price is currently near major support levels (2.279, 2.172), with resistance far above, indicating a wide range and potential for volatility if these levels are tested or breached. The market is consolidating within a neutral Fib grid context, with no clear breakout or breakdown, and remains sensitive to fundamental drivers such as seasonal demand, storage reports, and macroeconomic news. Overall, the environment is characterized by consolidation near lows, with a bearish bias dominating unless a significant reversal develops.
Chart Analysis ATS AI Generated: 2025-08-04 07:10 for Informational use only, not trading advice. Terms and Risk Disclosure Copyright © 2025. Algo Trading Systems LLC.
