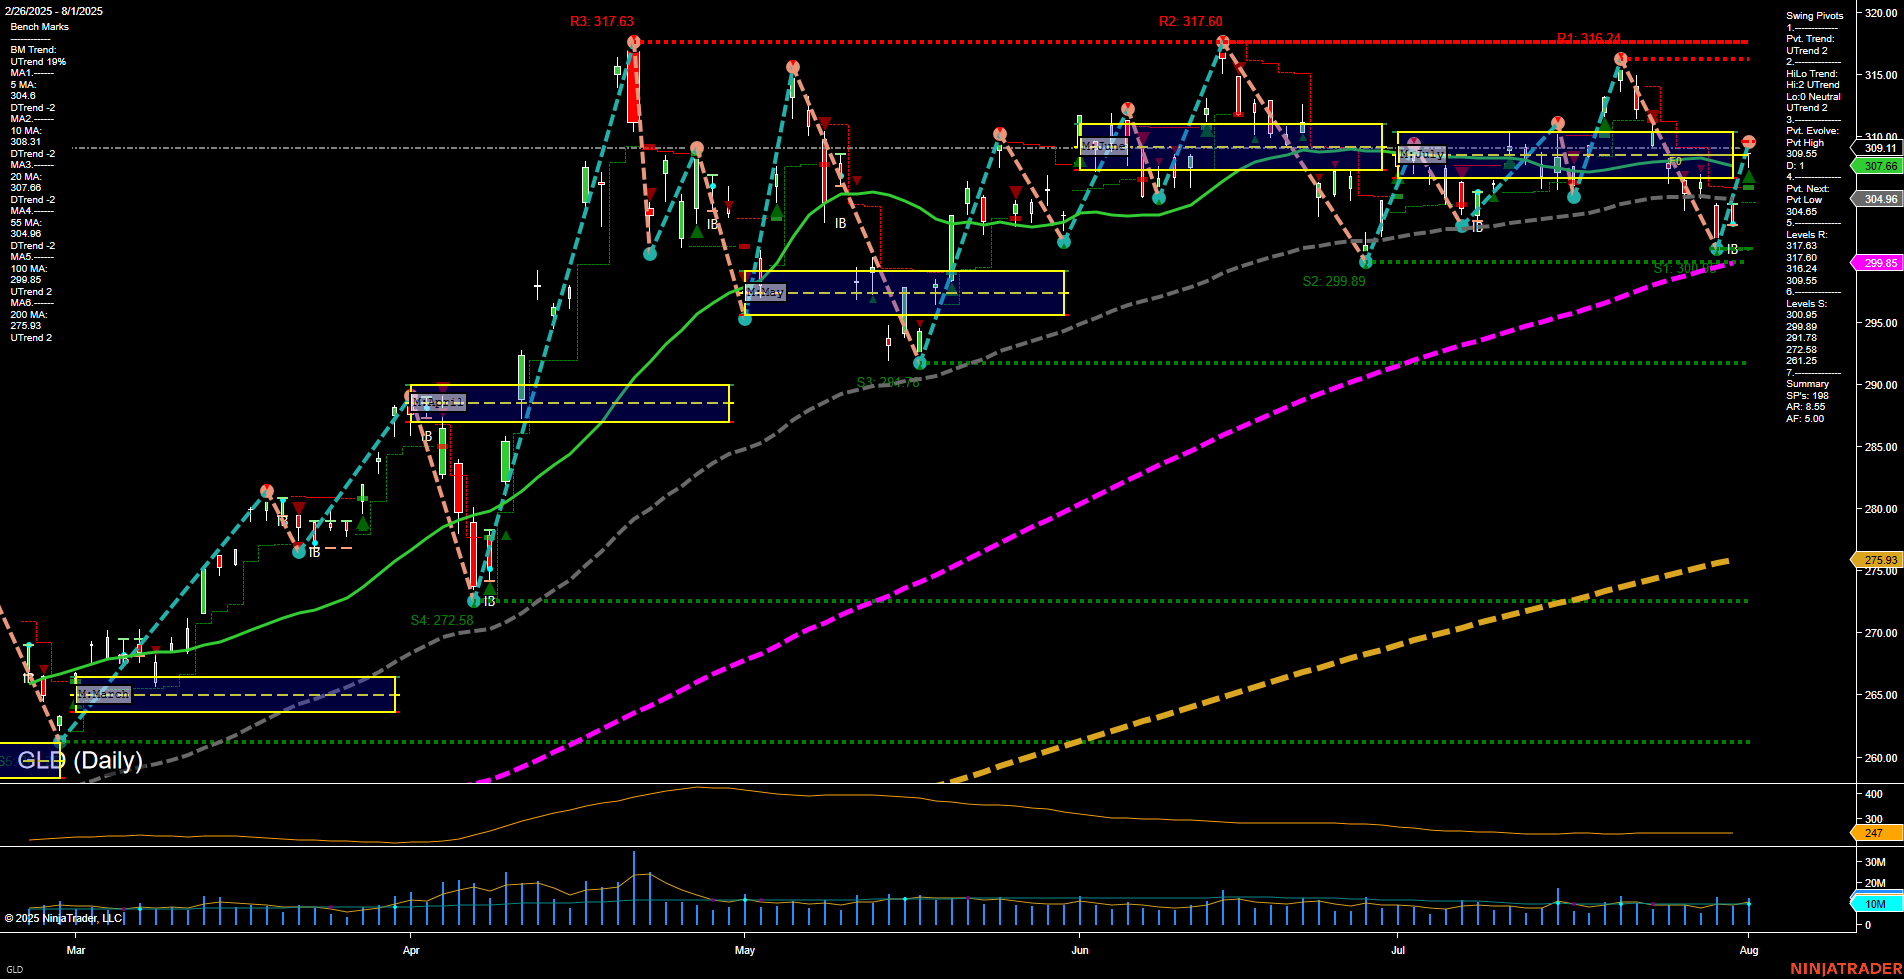
GLD SPDR Gold Shares Daily Chart Analysis: 2025-Aug-04 07:09 CT
Price Action
- Last: 307.66,
- Bars: Medium,
- Mom: Momentum average.
WSFG Weekly
- Short-Term
- WSFG Current: NA%
- F0%/NTZ' Bias: Price Neutral,
- WSFG Trend: Neutral.
MSFG Month Aug
- Intermediate-Term
- MSFG Current: NA%
- F0%/NTZ' Bias: Price Neutral,
- MSFG Trend: Neutral.
YSFG Year 2025
- Long-Term
- YSFG Current: NA%
- F0%/NTZ' Bias: Price Neutral,
- YSFG Trend: Neutral.
Swing Pivots
- (Short-Term) 1. Pvt. Trend: UTrend,
- (Intermediate-Term) 2. HiLo Trend: UTrend,
- 3. Pvt. Evolve: Pvt High 309.11,
- 4. Pvt. Next: Pvt Low 304.65,
- 5. Levels R: 317.63, 317.60, 316.24, 309.11, 304.65,
- 6. Levels S: 299.89, 291.78, 281.78, 272.58.
Daily Benchmarks
- (Short-Term) 5 Day: 306.44 Up Trend,
- (Short-Term) 10 Day: 308.31 Down Trend,
- (Intermediate-Term) 20 Day: 307.68 Down Trend,
- (Intermediate-Term) 55 Day: 299.85 Up Trend,
- (Long-Term) 100 Day: 285.43 Up Trend,
- (Long-Term) 200 Day: 275.93 Up Trend.
Additional Metrics
Overall Rating
- Short-Term: Neutral,
- Intermediate-Term: Neutral,
- Long-Term: Bullish.
Key Insights Summary
GLD is currently trading in a consolidation phase, with price action oscillating between well-defined resistance and support levels. The short-term and intermediate-term trends are neutral, as indicated by the flat to slightly mixed moving averages and the neutral bias from both the weekly and monthly session fib grids. The most recent swing pivot shows an uptrend, but the next pivot is set at a lower price, suggesting a potential test of support. The long-term trend remains bullish, supported by the upward sloping 55, 100, and 200-day moving averages. Volatility, as measured by ATR, is moderate, and volume remains steady. The market is in a holding pattern, awaiting a breakout above resistance or a breakdown below support to define the next directional move. This environment is typical of a market digesting prior gains, with traders watching for a catalyst to trigger the next trend leg.
Chart Analysis ATS AI Generated: 2025-08-04 07:10 for Informational use only, not trading advice. Terms and Risk Disclosure Copyright © 2025. Algo Trading Systems LLC.
