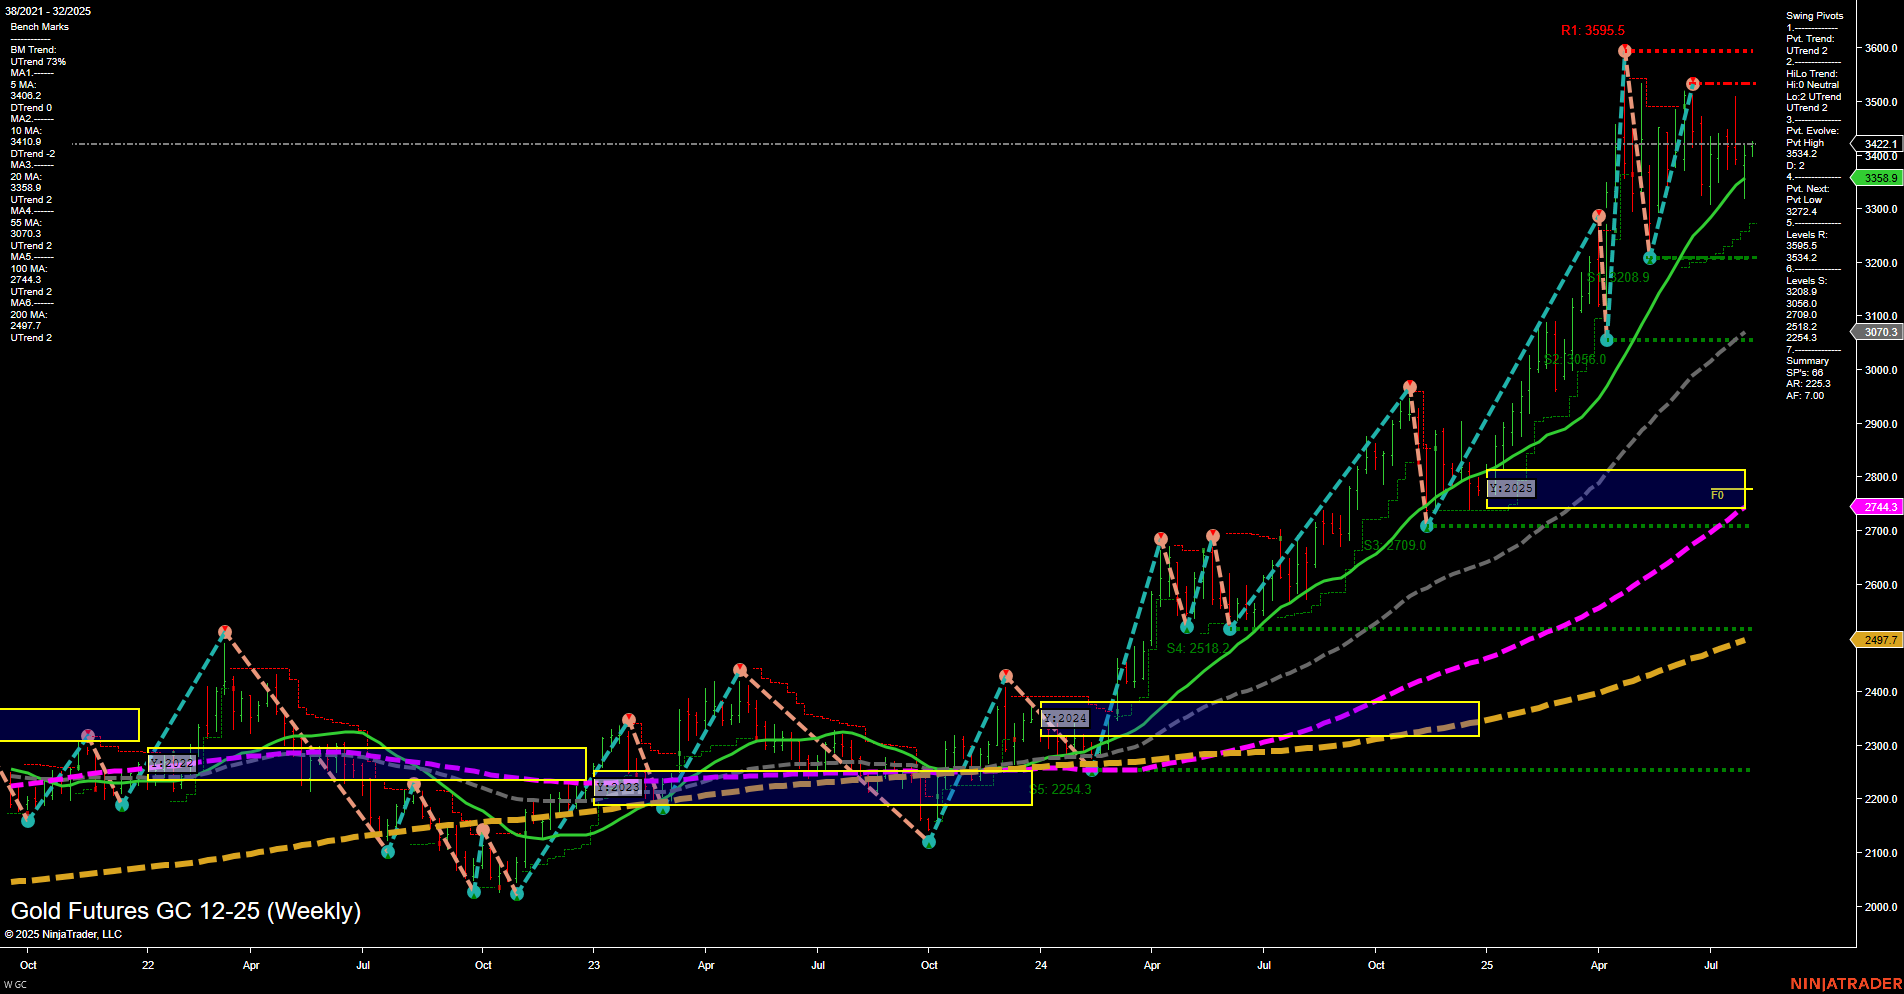
GC Gold Futures Weekly Chart Analysis: 2025-Aug-04 07:09 CT
Price Action
- Last: 3421.9,
- Bars: Medium,
- Mom: Momentum average.
WSFG Weekly
- Short-Term
- WSFG Current: 8%
- F0%/NTZ' Bias: Price Above,
- WSFG Trend: Up.
MSFG Month Aug
- Intermediate-Term
- MSFG Current: 26%
- F0%/NTZ' Bias: Price Above,
- MSFG Trend: Up.
YSFG Year 2025
- Long-Term
- YSFG Current: 180%
- F0%/NTZ' Bias: Price Above,
- YSFG Trend: Up.
Swing Pivots
- (Short-Term) 1. Pvt. Trend: UTrend,
- (Intermediate-Term) 2. HiLo Trend: UTrend,
- 3. Pvt. Evolve: Pvt High 3595.5,
- 4. Pvt. Next: Pvt Low 3274.2,
- 5. Levels R: 3595.5, 3534.2, 3506.0, 3421.9,
- 6. Levels S: 3274.2, 3208.0, 3070.3, 2744.3, 2497.7.
Weekly Benchmarks
- (Intermediate-Term) 5 Week: 3404.2 Up Trend,
- (Intermediate-Term) 10 Week: 3419.0 Up Trend,
- (Long-Term) 20 Week: 3358.9 Up Trend,
- (Long-Term) 55 Week: 3070.3 Up Trend,
- (Long-Term) 100 Week: 2744.3 Up Trend,
- (Long-Term) 200 Week: 2497.7 Up Trend.
Recent Trade Signals
- 04 Aug 2025: Long GC 12-25 @ 3410.9 Signals.USAR-MSFG
- 01 Aug 2025: Long GC 12-25 @ 3401.2 Signals.USAR.TR120
- 01 Aug 2025: Long GC 12-25 @ 3394.1 Signals.USAR-WSFG
- 28 Jul 2025: Short GC 12-25 @ 3370.9 Signals.USAR.TR720
Overall Rating
- Short-Term: Bullish,
- Intermediate-Term: Bullish,
- Long-Term: Bullish.
Key Insights Summary
Gold futures continue to display a robust uptrend across all timeframes, with price action holding above key Fibonacci grid levels and all major moving averages trending upward. The most recent swing pivot is a high at 3595.5, with the next significant support at 3274.2, indicating a healthy distance between current price and major support. Recent trade signals have shifted decisively to the long side, confirming the prevailing bullish momentum. The market has shown resilience after minor pullbacks, consistently forming higher lows and higher highs, and there is no immediate sign of trend exhaustion. The technical structure suggests ongoing strength, with the potential for further upside as long as price remains above the key support and moving average levels.
Chart Analysis ATS AI Generated: 2025-08-04 07:09 for Informational use only, not trading advice. Terms and Risk Disclosure Copyright © 2025. Algo Trading Systems LLC.
