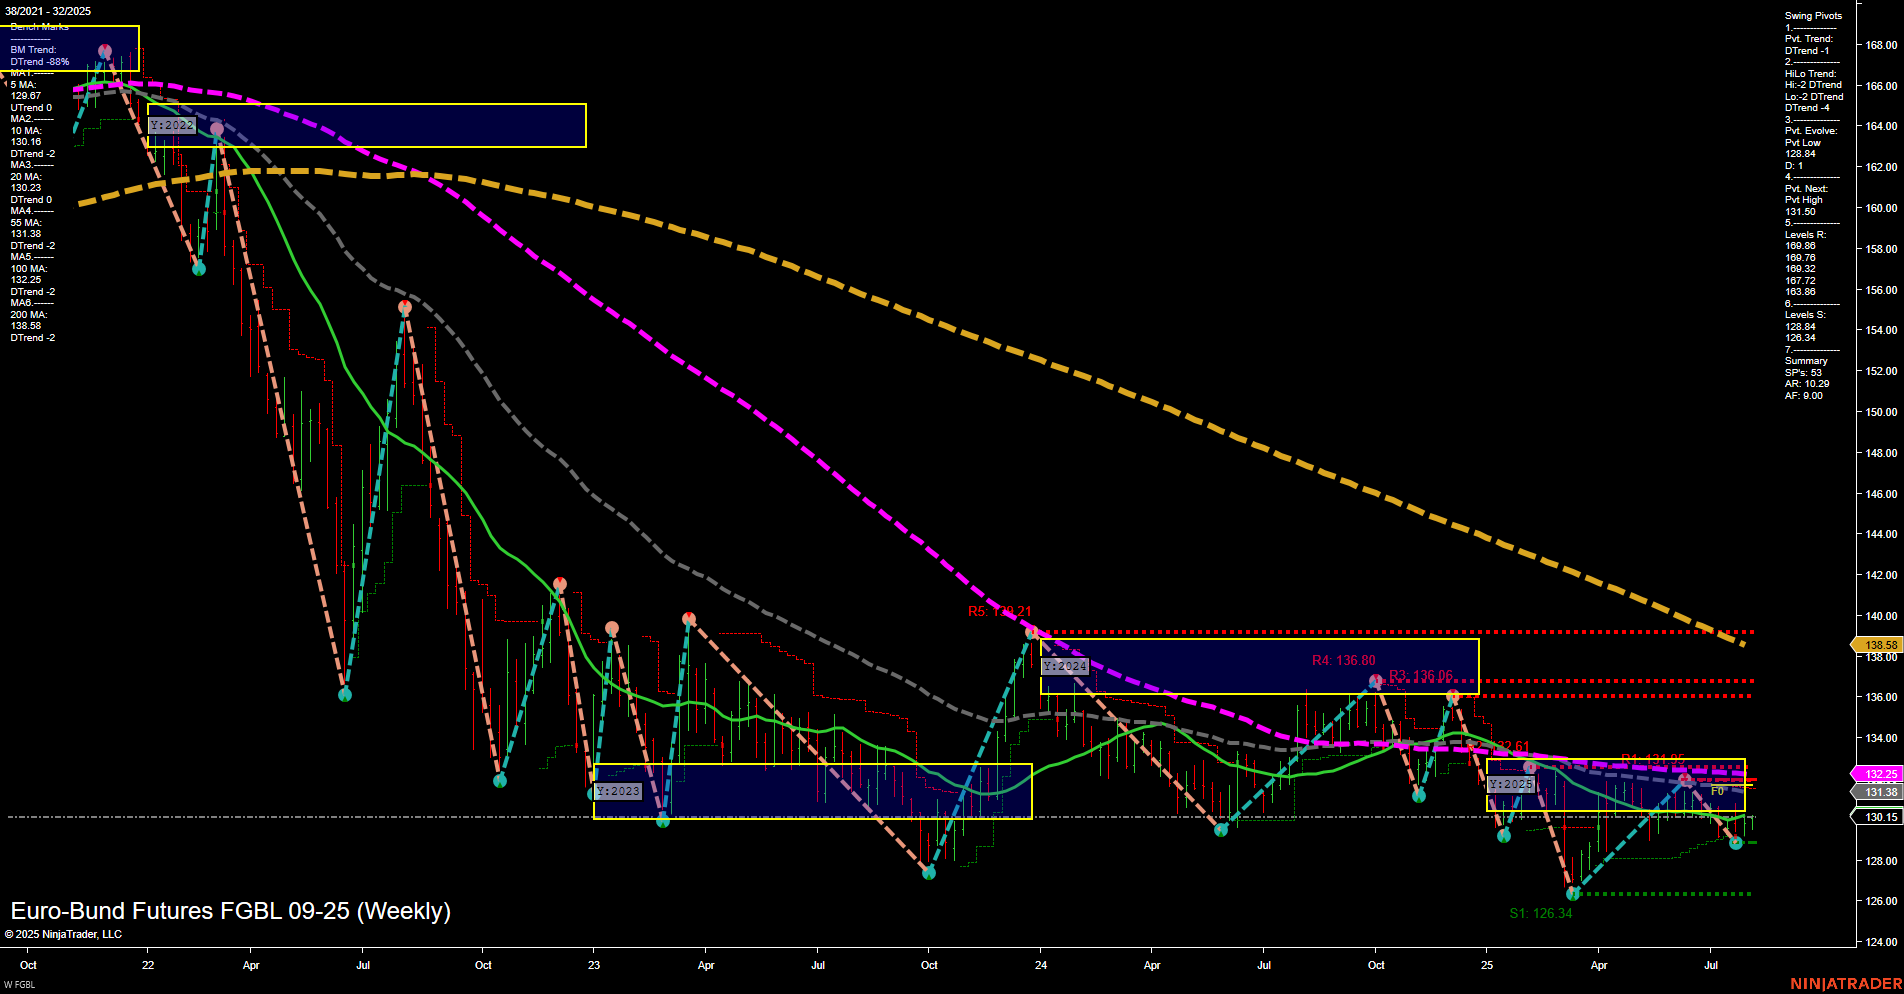
The FGBL Euro-Bund Futures weekly chart shows a market in transition. Price action is consolidating with medium-sized bars and slow momentum, indicating a lack of strong directional conviction. Short- and intermediate-term Fib grid trends (WSFG, MSFG) are both up, with price holding above their respective NTZ/F0% levels, suggesting some underlying bullish pressure in the near term. However, the long-term yearly grid (YSFG) remains in a downtrend, with price below the NTZ, reflecting persistent bearish sentiment on a broader horizon. Swing pivot analysis highlights a prevailing downtrend in both short- and intermediate-term pivots, with the most recent pivot low at 126.34 and the next resistance at 131.50. Multiple resistance levels cluster above, notably at 132.61, 134.21, and 136.80, which could cap rallies. Support is well-defined at 126.34 and 122.84. Benchmark moving averages reinforce the mixed outlook: the 20-week MA is trending up, but all other key long-term averages (55, 100, 200 week) are in downtrends and positioned above current price, acting as overhead resistance. Recent trade signals have triggered long entries, aligning with the short- and intermediate-term upward bias, but the overall structure remains constrained by the dominant long-term downtrend. In summary, the market is caught between short-term bullish attempts and a still-intact long-term bearish structure. Price is attempting to recover from recent lows but faces significant resistance overhead. The environment is characterized by consolidation and potential for choppy, range-bound action unless a decisive breakout or breakdown occurs.