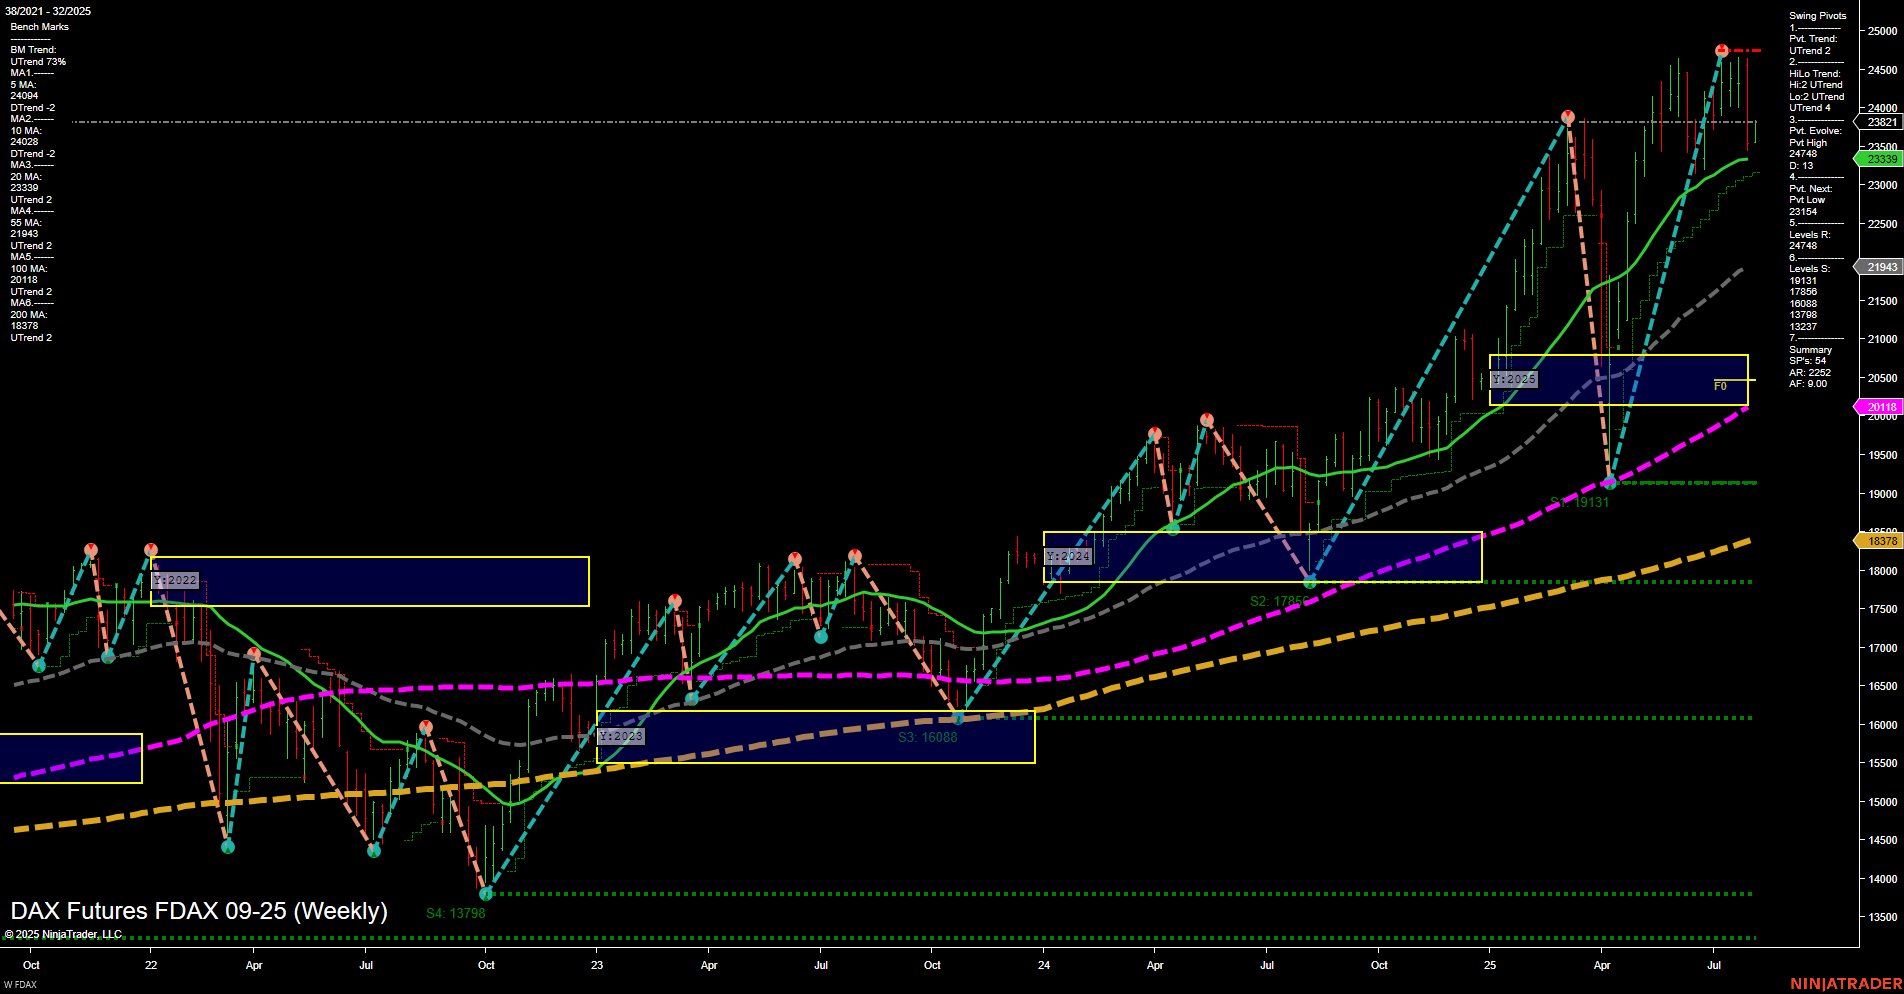
FDAX DAX Futures Weekly Chart Analysis: 2025-Aug-04 07:08 CT
Price Action
- Last: 23,630,
- Bars: Medium,
- Mom: Momentum average.
WSFG Weekly
- Short-Term
- WSFG Current: 32%
- F0%/NTZ' Bias: Price Above,
- WSFG Trend: Up.
MSFG Month Aug
- Intermediate-Term
- MSFG Current: -10%
- F0%/NTZ' Bias: Price Below,
- MSFG Trend: Down.
YSFG Year 2025
- Long-Term
- YSFG Current: 102%
- F0%/NTZ' Bias: Price Above,
- YSFG Trend: Up.
Swing Pivots
- (Short-Term) 1. Pvt. Trend: UTrend,
- (Intermediate-Term) 2. HiLo Trend: UTrend,
- 3. Pvt. Evolve: Pvt high 24,748,
- 4. Pvt. Next: Pvt low 23,114,
- 5. Levels R: 24,748, 24,521, 23,821, 23,621, 21,943,
- 6. Levels S: 19,131, 17,968, 16,088, 13,798.
Weekly Benchmarks
- (Intermediate-Term) 5 Week: 24,004 Down Trend,
- (Intermediate-Term) 10 Week: 24,762 Down Trend,
- (Long-Term) 20 Week: 23,339 Up Trend,
- (Long-Term) 55 Week: 20,118 Up Trend,
- (Long-Term) 100 Week: 20,618 Up Trend,
- (Long-Term) 200 Week: 18,378 Up Trend.
Recent Trade Signals
- 04 Aug 2025: Short FDAX 09-25 @ 23,637 Signals.USAR-MSFG
- 01 Aug 2025: Short FDAX 09-25 @ 23,544 Signals.USAR.TR720
- 31 Jul 2025: Short FDAX 09-25 @ 24,174 Signals.USAR.TR120
Overall Rating
- Short-Term: Neutral,
- Intermediate-Term: Bearish,
- Long-Term: Bullish.
Key Insights Summary
The FDAX weekly chart shows a market in transition. Price action remains above key long-term support levels, with the yearly and weekly session fib grids both trending up, indicating underlying bullishness for the long-term. However, the intermediate-term (monthly) trend has turned down, with price currently below the monthly NTZ and recent swing signals favoring the short side. Short-term swing pivots and the weekly fib grid still show upward momentum, but the 5- and 10-week moving averages have rolled over, reflecting recent weakness and a possible pullback or consolidation phase. The market is currently testing resistance near recent highs, with several short trade signals triggered in the past week, suggesting traders are positioning for a potential retracement. Long-term structure remains intact, but the intermediate-term correction could continue before the broader uptrend resumes. Volatility and choppy price action are likely as the market digests recent gains and tests key support and resistance levels.
Chart Analysis ATS AI Generated: 2025-08-04 07:08 for Informational use only, not trading advice. Terms and Risk Disclosure Copyright © 2025. Algo Trading Systems LLC.
