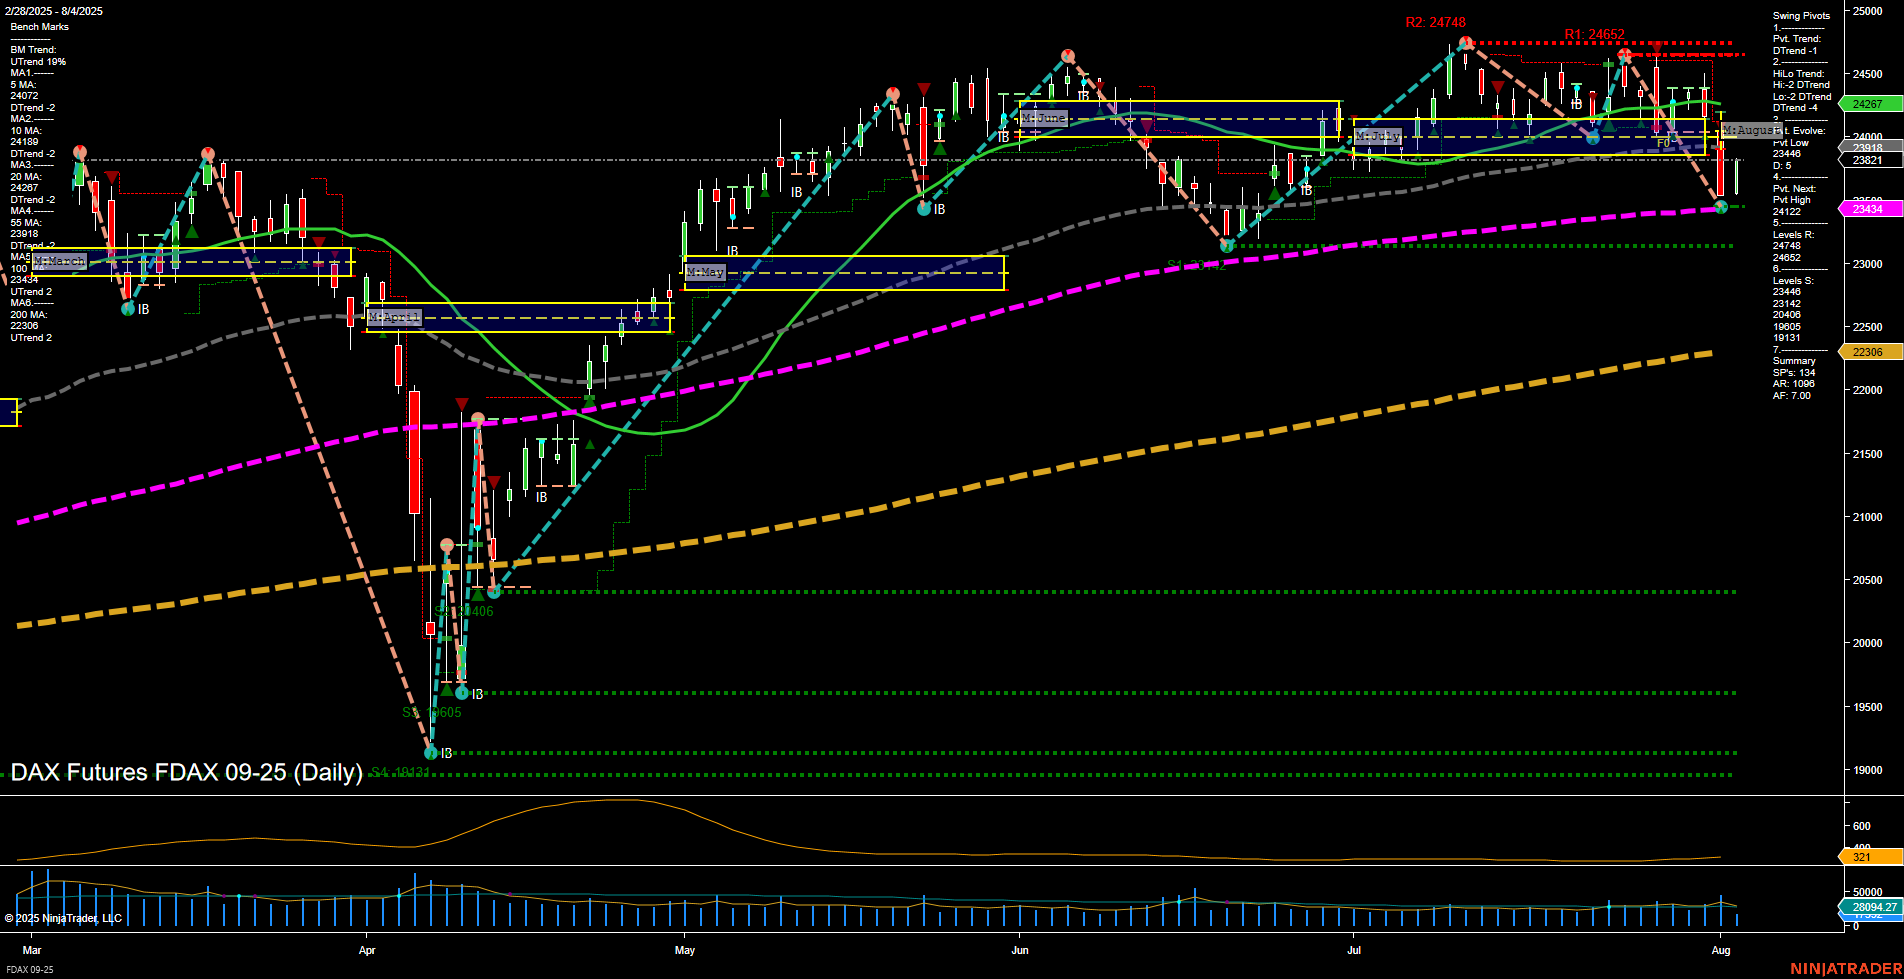
FDAX DAX Futures Daily Chart Analysis: 2025-Aug-04 07:07 CT
Price Action
- Last: 23,606,
- Bars: Large,
- Mom: Momentum fast.
WSFG Weekly
- Short-Term
- WSFG Current: 32%
- F0%/NTZ' Bias: Price Above,
- WSFG Trend: Up.
MSFG Month Aug
- Intermediate-Term
- MSFG Current: -10%
- F0%/NTZ' Bias: Price Below,
- MSFG Trend: Down.
YSFG Year 2025
- Long-Term
- YSFG Current: 102%
- F0%/NTZ' Bias: Price Above,
- YSFG Trend: Up.
Swing Pivots
- (Short-Term) 1. Pvt. Trend: DTrend,
- (Intermediate-Term) 2. HiLo Trend: DTrend,
- 3. Pvt. Evolve: Pvt low 23,606,
- 4. Pvt. Next: Pvt high 24,652,
- 5. Levels R: 24,748, 24,652, 24,134, 23,812, 23,410, 20,805, 19,131,
- 6. Levels S: 23,606.
Daily Benchmarks
- (Short-Term) 5 Day: 24,072 Down Trend,
- (Short-Term) 10 Day: 24,267 Down Trend,
- (Intermediate-Term) 20 Day: 23,434 Down Trend,
- (Intermediate-Term) 55 Day: 23,134 Up Trend,
- (Long-Term) 100 Day: 22,306 Up Trend,
- (Long-Term) 200 Day: 21,422 Up Trend.
Additional Metrics
Recent Trade Signals
- 04 Aug 2025: Short FDAX 09-25 @ 23,637 Signals.USAR-MSFG
- 01 Aug 2025: Short FDAX 09-25 @ 23,544 Signals.USAR.TR720
- 31 Jul 2025: Short FDAX 09-25 @ 24,174 Signals.USAR.TR120
Overall Rating
- Short-Term: Bearish,
- Intermediate-Term: Bearish,
- Long-Term: Bullish.
Key Insights Summary
The FDAX is currently experiencing a sharp pullback, with fast momentum and large daily bars indicating heightened volatility. Short-term and intermediate-term trends have shifted to bearish, as confirmed by both the swing pivot structure and the downward direction of the 5, 10, and 20-day moving averages. The price has broken below the monthly session fib grid (MSFG) neutral zone, reinforcing the intermediate-term downtrend, while the weekly session fib grid (WSFG) remains positive, suggesting some underlying support on a shorter time frame. Long-term structure is still bullish, with the 55, 100, and 200-day moving averages trending upward and price well above these levels. Recent trade signals have all been to the short side, reflecting the current bearish momentum. Key resistance levels are clustered above 24,000, with immediate support at the recent swing low of 23,606. The market is in a corrective phase within a broader uptrend, and traders are watching for signs of stabilization or further downside follow-through.
Chart Analysis ATS AI Generated: 2025-08-04 07:08 for Informational use only, not trading advice. Terms and Risk Disclosure Copyright © 2025. Algo Trading Systems LLC.
