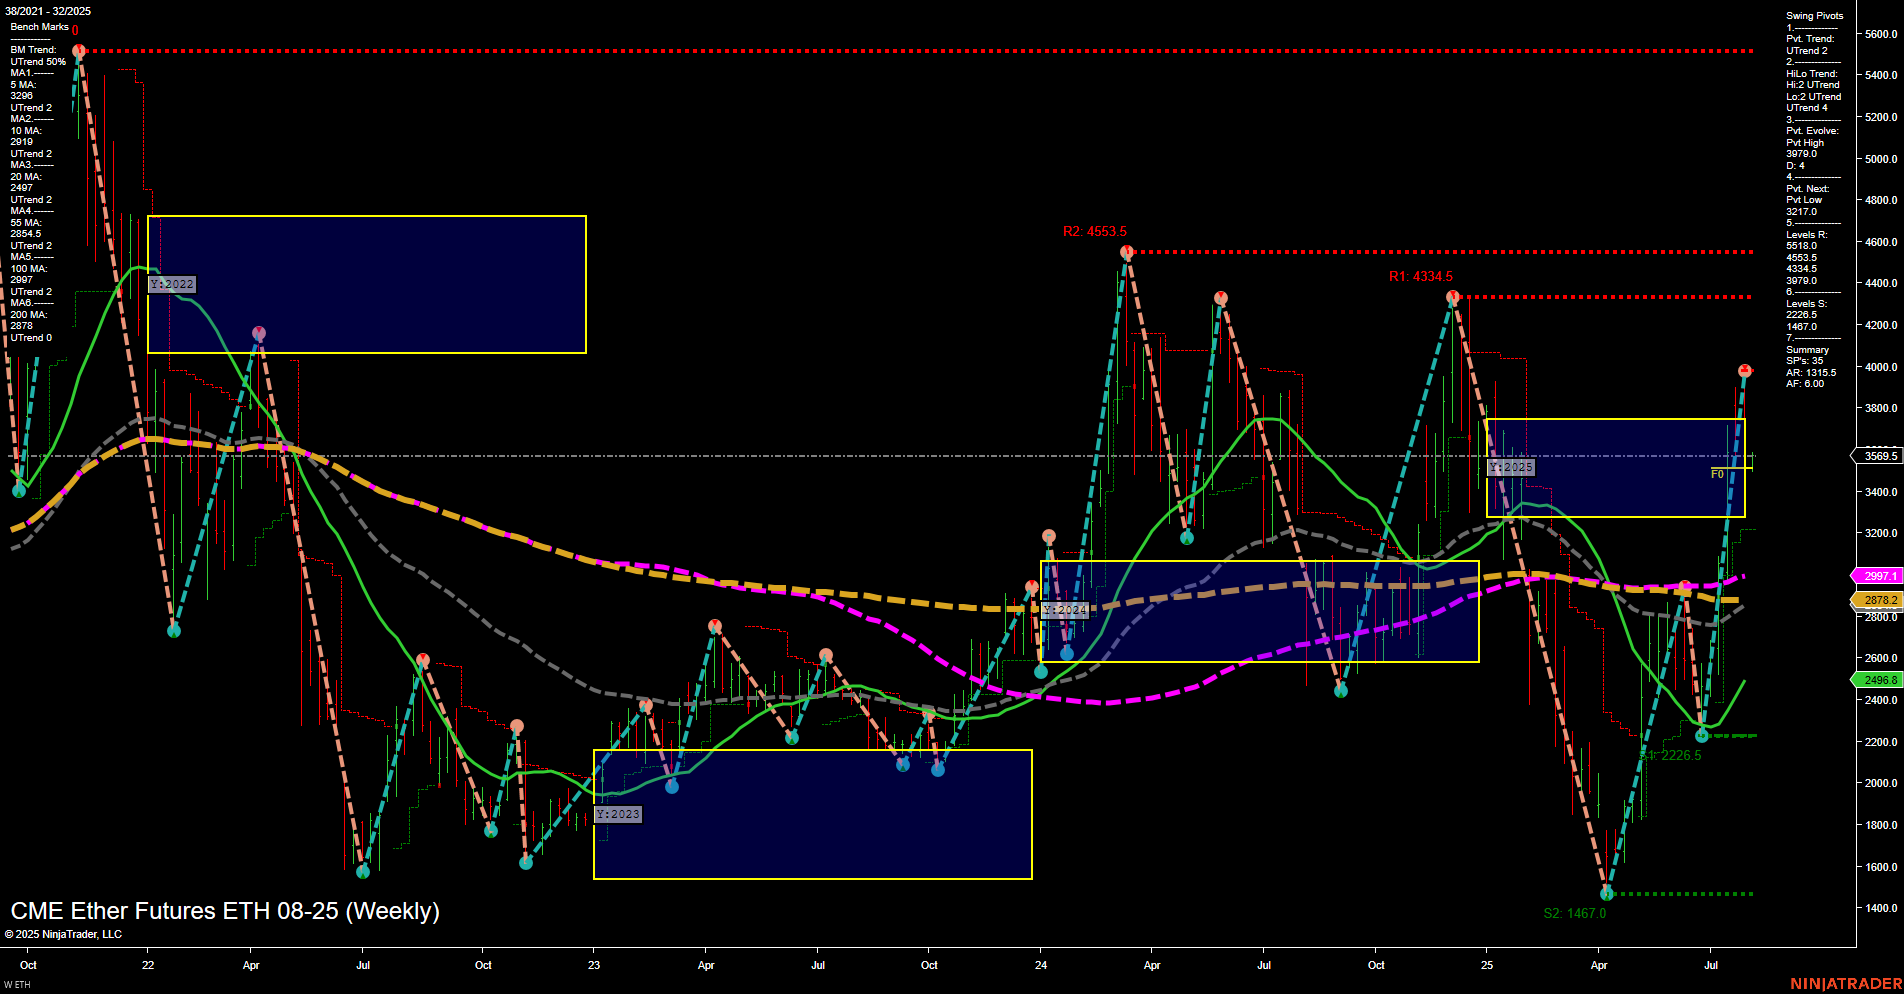
ETH CME Ether Futures Weekly Chart Analysis: 2025-Aug-04 07:07 CT
Price Action
- Last: 3507,
- Bars: Large,
- Mom: Momentum fast.
WSFG Weekly
- Short-Term
- WSFG Current: 10%
- F0%/NTZ' Bias: Price Above,
- WSFG Trend: Up.
MSFG Month Aug
- Intermediate-Term
- MSFG Current: -15%
- F0%/NTZ' Bias: Price Below,
- MSFG Trend: Down.
YSFG Year 2025
- Long-Term
- YSFG Current: 2%
- F0%/NTZ' Bias: Price Above,
- YSFG Trend: Up.
Swing Pivots
- (Short-Term) 1. Pvt. Trend: UTrend,
- (Intermediate-Term) 2. HiLo Trend: UTrend,
- 3. Pvt. Evolve: Pvt high 3717.0,
- 4. Pvt. Next: Pvt low 3271.0,
- 5. Levels R: 4553.5, 4334.5, 3717.0,
- 6. Levels S: 2226.5, 1467.0.
Weekly Benchmarks
- (Intermediate-Term) 5 Week: 2997.1 Up Trend,
- (Intermediate-Term) 10 Week: 2878.2 Up Trend,
- (Long-Term) 20 Week: 2496.8 Up Trend,
- (Long-Term) 55 Week: 2697.9 Up Trend,
- (Long-Term) 100 Week: 2667.9 Up Trend,
- (Long-Term) 200 Week: 2460.3 Up Trend.
Recent Trade Signals
- 04 Aug 2025: Short ETH 08-25 @ 3507 Signals.USAR-WSFG
- 04 Aug 2025: Short ETH 08-25 @ 3507 Signals.USAR-MSFG
- 01 Aug 2025: Short ETH 08-25 @ 3713 Signals.USAR.TR120
Overall Rating
- Short-Term: Neutral,
- Intermediate-Term: Bearish,
- Long-Term: Bullish.
Key Insights Summary
The weekly chart for ETH CME Ether Futures as of early August 2025 shows a market in transition. Price action has been strong and volatile, with large bars and fast momentum, indicating heightened activity and possible exhaustion after a sharp move. The short-term WSFG trend is up, with price above the NTZ center, but recent trade signals have triggered short entries, suggesting a potential short-term reversal or at least a pause in the uptrend. Intermediate-term MSFG is trending down, with price below its NTZ, reflecting a counter-trend move or corrective phase within a broader uptrend. Long-term YSFG and all major moving averages remain in uptrends, supporting a bullish structural backdrop. Swing pivots show the most recent evolution at a pivot high (3717.0) with the next key support at 3271.0, and major resistance levels above at 3717.0, 4334.5, and 4553.5. The overall picture is one of a market that has rallied strongly but is now encountering resistance and may be entering a consolidation or pullback phase in the short to intermediate term, while the long-term trend remains intact to the upside.
Chart Analysis ATS AI Generated: 2025-08-04 07:07 for Informational use only, not trading advice. Terms and Risk Disclosure Copyright © 2025. Algo Trading Systems LLC.
