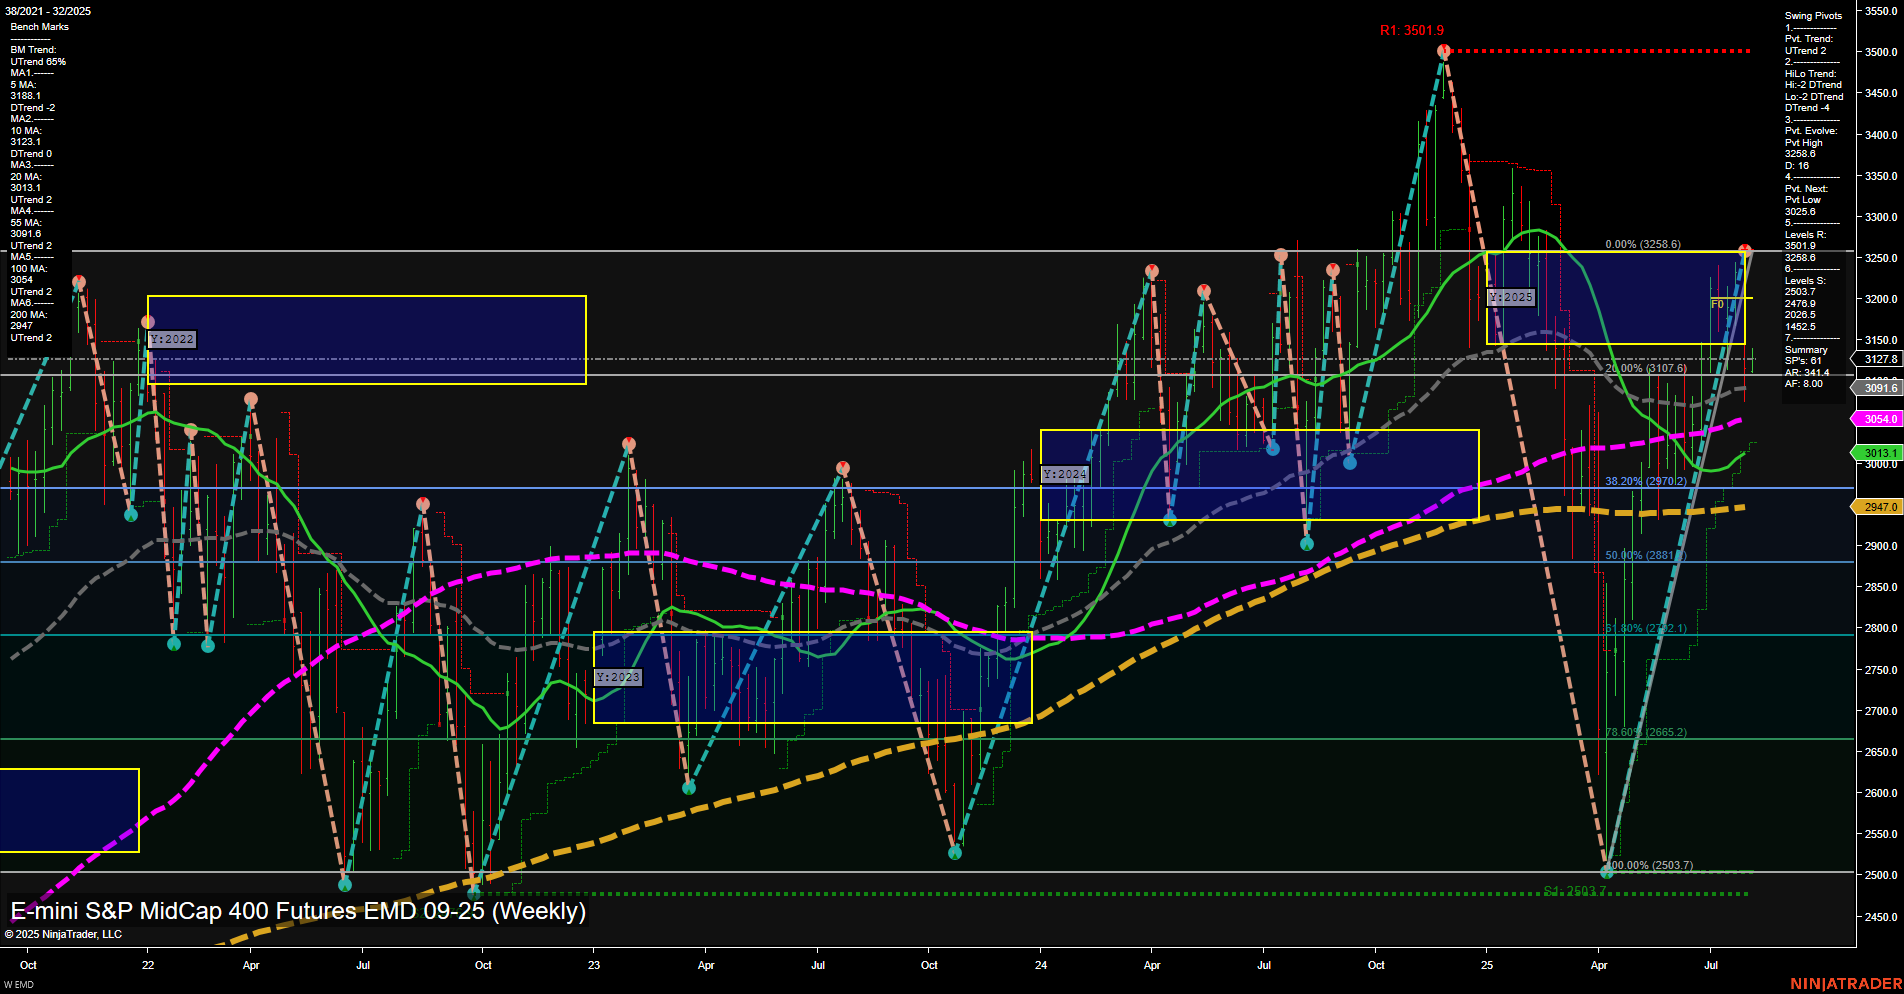
EMD E-mini S&P MidCap 400 Futures Weekly Chart Analysis: 2025-Aug-04 07:05 CT
Price Action
- Last: 3091.6,
- Bars: Large,
- Mom: Momentum fast.
WSFG Weekly
- Short-Term
- WSFG Current: 17%
- F0%/NTZ' Bias: Price Above,
- WSFG Trend: Up.
MSFG Month Aug
- Intermediate-Term
- MSFG Current: -15%
- F0%/NTZ' Bias: Price Below,
- MSFG Trend: Down.
YSFG Year 2025
- Long-Term
- YSFG Current: -13%
- F0%/NTZ' Bias: Price Below,
- YSFG Trend: Down.
Swing Pivots
- (Short-Term) 1. Pvt. Trend: UTrend,
- (Intermediate-Term) 2. HiLo Trend: DTrend,
- 3. Pvt. Evolve: Pvt high 3268.9,
- 4. Pvt. Next: Pvt low 2841.4,
- 5. Levels R: 3268.9, 3501.9,
- 6. Levels S: 3017.0, 2841.4.
Weekly Benchmarks
- (Intermediate-Term) 5 Week: 3121.0 Down Trend,
- (Intermediate-Term) 10 Week: 3133.4 Down Trend,
- (Long-Term) 20 Week: 3013.1 Up Trend,
- (Long-Term) 55 Week: 3050.4 Up Trend,
- (Long-Term) 100 Week: 2947.0 Up Trend,
- (Long-Term) 200 Week: 2503.7 Up Trend.
Recent Trade Signals
- 01 Aug 2025: Short EMD 09-25 @ 3118 Signals.USAR.TR720
- 30 Jul 2025: Short EMD 09-25 @ 3231.4 Signals.USAR-WSFG
Overall Rating
- Short-Term: Neutral,
- Intermediate-Term: Bearish,
- Long-Term: Bullish.
Key Insights Summary
The EMD futures chart shows a market in transition, with recent volatility and large price swings. Short-term momentum is fast, and the price is currently above the weekly session fib grid (WSFG) neutral zone, indicating some upward bias in the immediate term. However, the intermediate-term (monthly) and long-term (yearly) fib grids both show the price below their respective neutral zones, with downtrends in place. Swing pivots highlight a recent pivot high at 3268.9 and a next potential support at 2841.4, with resistance at 3268.9 and 3501.9. The 5- and 10-week moving averages are trending down, reflecting recent weakness, while the longer-term 20-, 55-, 100-, and 200-week moving averages remain in uptrends, suggesting underlying long-term strength. Recent trade signals have triggered short entries, aligning with the intermediate-term bearish trend. Overall, the market is experiencing a pullback within a broader long-term uptrend, with short-term action caught between support and resistance as traders assess whether the recent selloff will continue or if a base is forming for a potential recovery.
Chart Analysis ATS AI Generated: 2025-08-04 07:06 for Informational use only, not trading advice. Terms and Risk Disclosure Copyright © 2025. Algo Trading Systems LLC.
