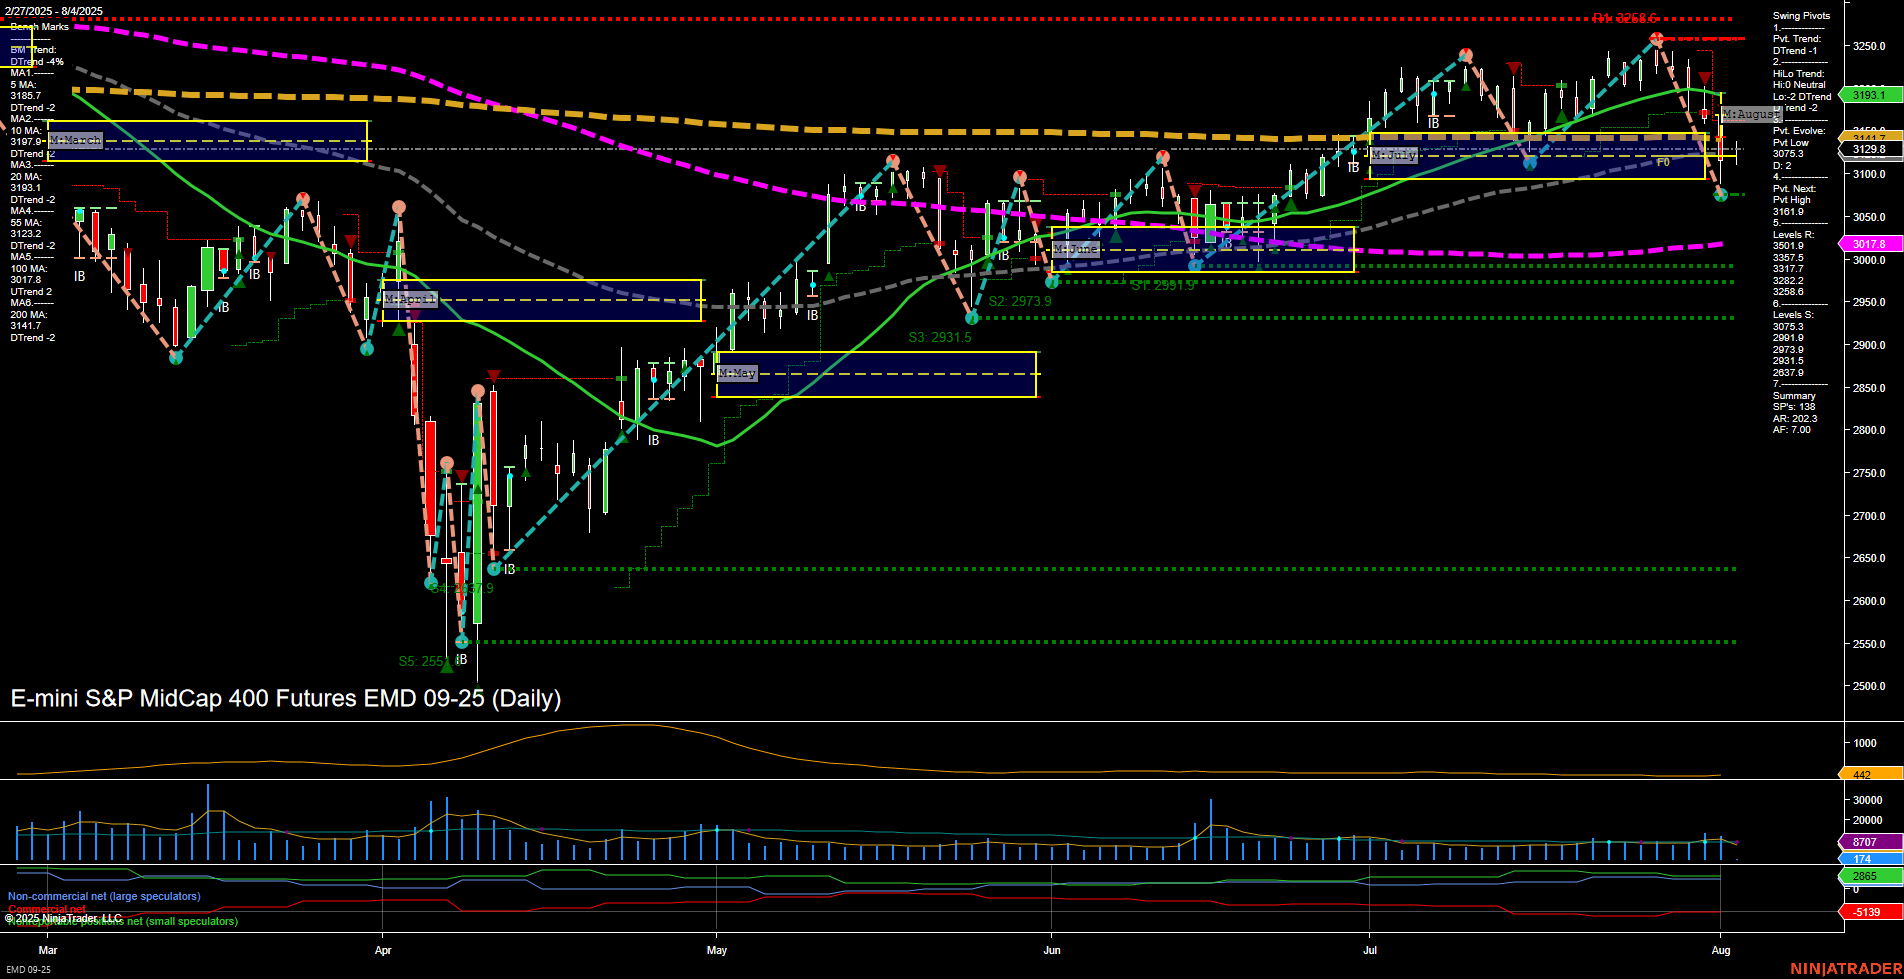
EMD E-mini S&P MidCap 400 Futures Daily Chart Analysis: 2025-Aug-04 07:05 CT
Price Action
- Last: 3129.8,
- Bars: Medium,
- Mom: Momentum slow.
WSFG Weekly
- Short-Term
- WSFG Current: 17%
- F0%/NTZ' Bias: Price Above,
- WSFG Trend: Up.
MSFG Month Aug
- Intermediate-Term
- MSFG Current: -15%
- F0%/NTZ' Bias: Price Below,
- MSFG Trend: Down.
YSFG Year 2025
- Long-Term
- YSFG Current: -13%
- F0%/NTZ' Bias: Price Below,
- YSFG Trend: Down.
Swing Pivots
- (Short-Term) 1. Pvt. Trend: DTrend,
- (Intermediate-Term) 2. HiLo Trend: DTrend,
- 3. Pvt. Evolve: Pvt low 3129.8,
- 4. Pvt. Next: Pvt high 3193.1,
- 5. Levels R: 3258.6, 3237.5, 3222.6, 3185.7, 3141.4,
- 6. Levels S: 3071.8, 2973.9, 2931.5, 2837.9, 2551.6.
Daily Benchmarks
- (Short-Term) 5 Day: 3185.7 Down Trend,
- (Short-Term) 10 Day: 3193.1 Down Trend,
- (Intermediate-Term) 20 Day: 3141.4 Down Trend,
- (Intermediate-Term) 55 Day: 3071.8 Up Trend,
- (Long-Term) 100 Day: 3017.6 Up Trend,
- (Long-Term) 200 Day: 3187.0 Down Trend.
Additional Metrics
Recent Trade Signals
- 01 Aug 2025: Short EMD 09-25 @ 3118 Signals.USAR.TR720
- 30 Jul 2025: Short EMD 09-25 @ 3231.4 Signals.USAR-WSFG
Overall Rating
- Short-Term: Bearish,
- Intermediate-Term: Bearish,
- Long-Term: Bearish.
Key Insights Summary
The EMD futures daily chart is showing a clear shift to the downside across all major timeframes. Price action has recently broken below the monthly and yearly session fib grid centers, with momentum slowing and medium-sized bars indicating a transition from prior consolidation to a more directional move. Both short-term and intermediate-term swing pivot trends are down, with the most recent pivot low at 3129.8 and the next potential reversal at 3193.1. Resistance levels are stacked above, while support is notably lower, suggesting room for further downside if selling persists. The 5, 10, and 20-day moving averages are all trending down, reinforcing the bearish short-term and intermediate-term outlook, while the 55 and 100-day averages are still up but could be tested if weakness continues. Recent trade signals have triggered short entries, aligning with the prevailing downtrend. Volatility remains elevated (ATR 445), and volume is steady, supporting the current move. Overall, the technical landscape points to a bearish environment, with the potential for further declines unless a significant reversal develops at key support levels.
Chart Analysis ATS AI Generated: 2025-08-04 07:05 for Informational use only, not trading advice. Terms and Risk Disclosure Copyright © 2025. Algo Trading Systems LLC.
