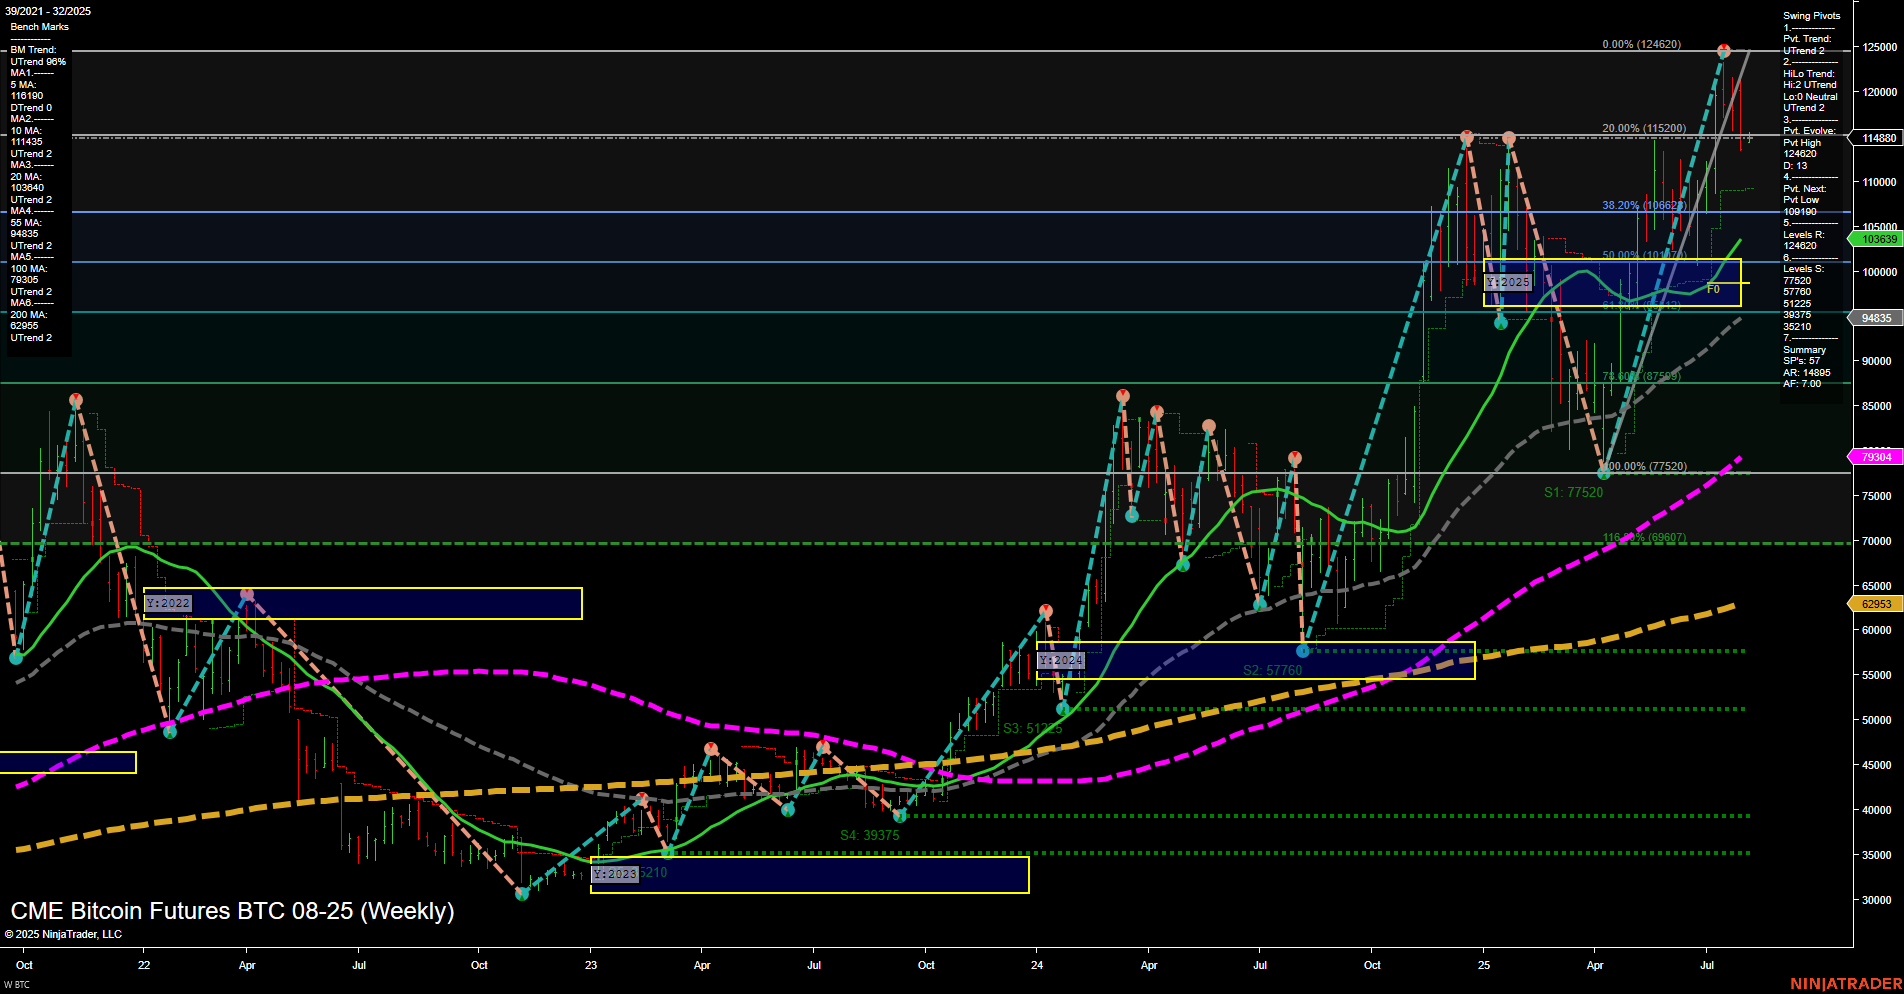
BTC CME Bitcoin Futures Weekly Chart Analysis: 2025-Aug-04 07:03 CT
Price Action
- Last: 114850,
- Bars: Large,
- Mom: Momentum fast.
WSFG Weekly
- Short-Term
- WSFG Current: 7%
- F0%/NTZ' Bias: Price Above,
- WSFG Trend: Up.
MSFG Month Aug
- Intermediate-Term
- MSFG Current: -6%
- F0%/NTZ' Bias: Price Below,
- MSFG Trend: Down.
YSFG Year 2025
- Long-Term
- YSFG Current: 61%
- F0%/NTZ' Bias: Price Above,
- YSFG Trend: Up.
Swing Pivots
- (Short-Term) 1. Pvt. Trend: UTrend,
- (Intermediate-Term) 2. HiLo Trend: UTrend,
- 3. Pvt. Evolve: Pvt high 124620,
- 4. Pvt. Next: Pvt low 103539,
- 5. Levels R: 124620, 115200, 106627,
- 6. Levels S: 103539, 94835, 77520.
Weekly Benchmarks
- (Intermediate-Term) 5 Week: 111940 Up Trend,
- (Intermediate-Term) 10 Week: 111435 Up Trend,
- (Long-Term) 20 Week: 103960 Up Trend,
- (Long-Term) 55 Week: 95365 Up Trend,
- (Long-Term) 100 Week: 79904 Up Trend,
- (Long-Term) 200 Week: 62935 Up Trend.
Recent Trade Signals
- 01 Aug 2025: Short BTC 08-25 @ 113550 Signals.USAR-MSFG
- 31 Jul 2025: Short BTC 08-25 @ 117450 Signals.USAR.TR120
Overall Rating
- Short-Term: Bullish,
- Intermediate-Term: Neutral,
- Long-Term: Bullish.
Key Insights Summary
BTC CME Bitcoin Futures are exhibiting strong bullish momentum on the weekly timeframe, with price action characterized by large bars and fast momentum, confirming an aggressive uptrend. The short-term WSFG and long-term YSFG both show price well above their respective NTZ/F0% levels, reinforcing the prevailing upward bias. All benchmark moving averages from 5 to 200 weeks are trending up, providing robust support for the long-term bullish structure. Swing pivots highlight a recent high at 124620, with the next key support at 103539, suggesting the market is in a higher-high, higher-low sequence. However, the intermediate-term MSFG trend is down, and recent trade signals have triggered short entries, indicating potential for a corrective pullback or consolidation phase. Overall, the market remains structurally bullish, but with some short-term froth and the possibility of a retracement as the market digests recent gains and tests support levels.
Chart Analysis ATS AI Generated: 2025-08-04 07:04 for Informational use only, not trading advice. Terms and Risk Disclosure Copyright © 2025. Algo Trading Systems LLC.
