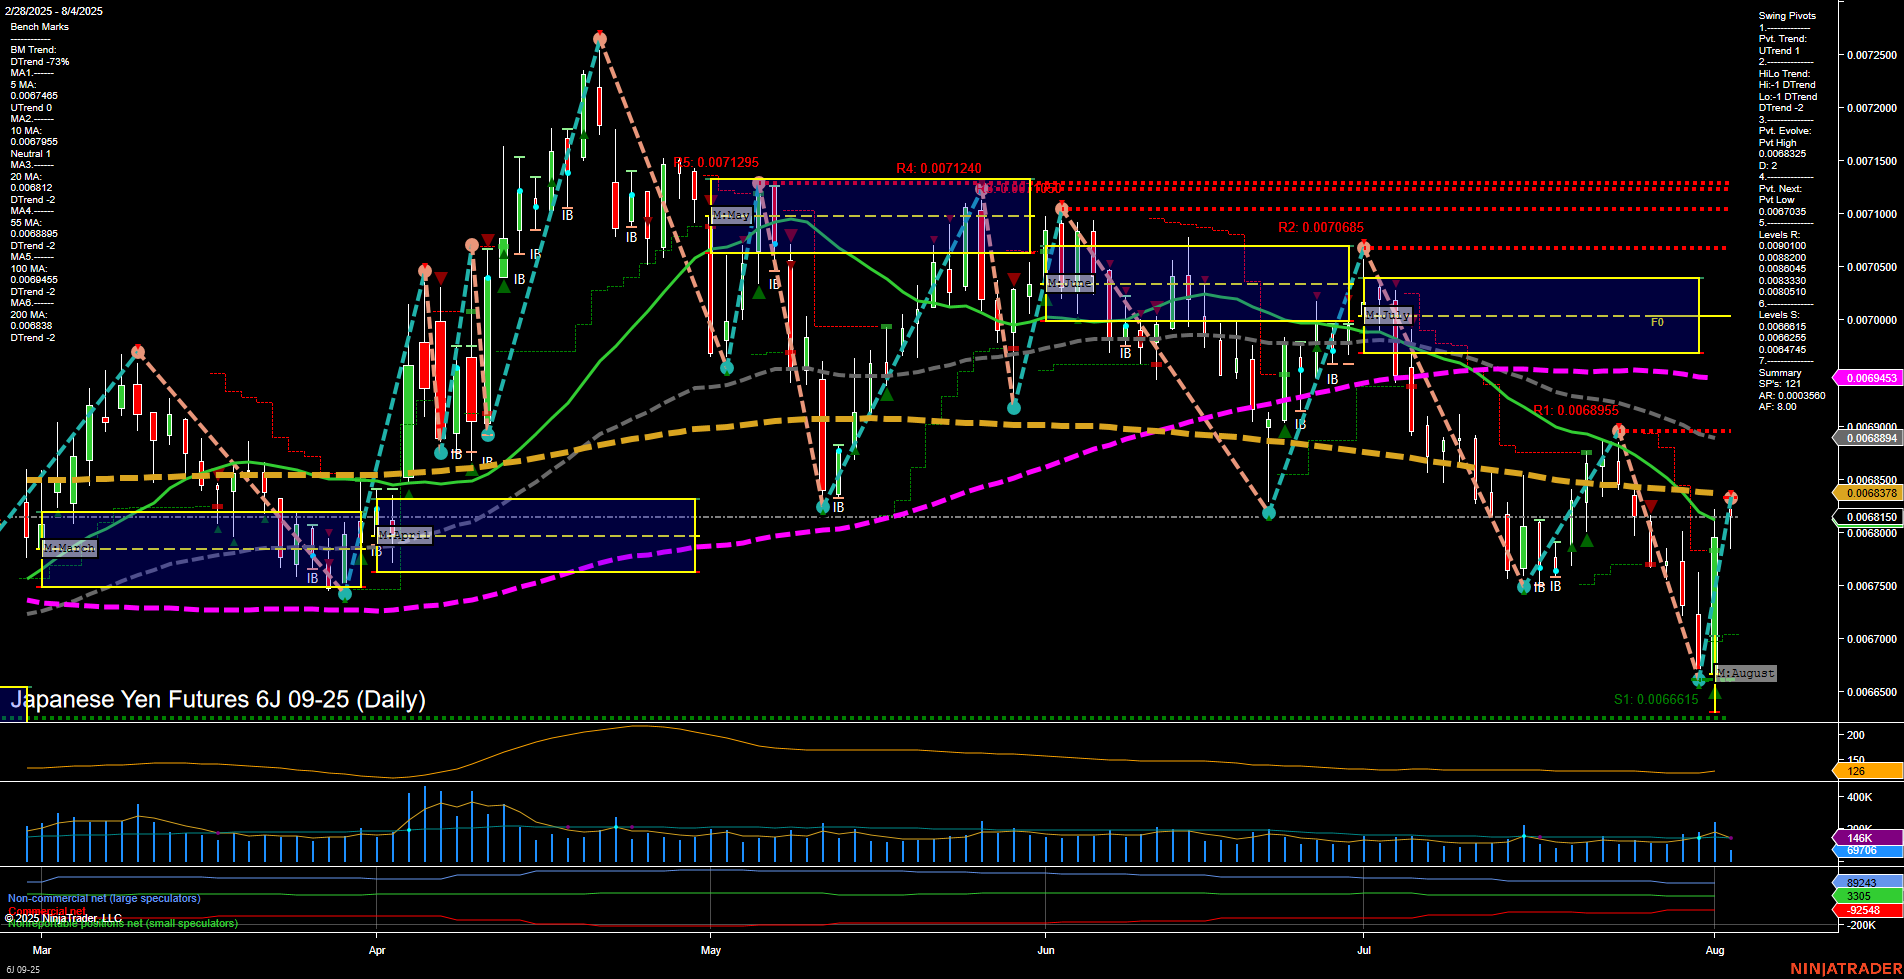
6J Japanese Yen Futures Daily Chart Analysis: 2025-Aug-04 07:02 CT
Price Action
- Last: 0.0068376,
- Bars: Large,
- Mom: Momentum fast.
WSFG Weekly
- Short-Term
- WSFG Current: -3%
- F0%/NTZ' Bias: Price Below,
- WSFG Trend: Down.
MSFG Month Aug
- Intermediate-Term
- MSFG Current: 42%
- F0%/NTZ' Bias: Price Above,
- MSFG Trend: Up.
YSFG Year 2025
- Long-Term
- YSFG Current: 24%
- F0%/NTZ' Bias: Price Above,
- YSFG Trend: Up.
Swing Pivots
- (Short-Term) 1. Pvt. Trend: UTrend,
- (Intermediate-Term) 2. HiLo Trend: DTrend,
- 3. Pvt. Evolve: Pvt low 0.0066525,
- 4. Pvt. Next: Pvt low 0.0067035,
- 5. Levels R: 0.0072500, 0.0072000, 0.0071295, 0.0071240, 0.0070685, 0.0069595, 0.0069510, 0.0068840, 0.0068775, 0.0068475,
- 6. Levels S: 0.0066615.
Daily Benchmarks
- (Short-Term) 5 Day: 0.0067485 Down Trend,
- (Short-Term) 10 Day: 0.0067995 Down Trend,
- (Intermediate-Term) 20 Day: 0.0068588 Down Trend,
- (Intermediate-Term) 55 Day: 0.0068843 Down Trend,
- (Long-Term) 100 Day: 0.0069453 Down Trend,
- (Long-Term) 200 Day: 0.0068884 Down Trend.
Additional Metrics
Recent Trade Signals
- 01 Aug 2025: Long 6J 09-25 @ 0.0067865 Signals.USAR.TR120
- 30 Jul 2025: Short 6J 09-25 @ 0.006743 Signals.USAR.TR720
- 28 Jul 2025: Short 6J 09-25 @ 0.006793 Signals.USAR-WSFG
Overall Rating
- Short-Term: Neutral,
- Intermediate-Term: Bearish,
- Long-Term: Bullish.
Key Insights Summary
The 6J Japanese Yen Futures daily chart shows a recent surge in price action with large, fast momentum bars, indicating a strong short-term move off recent lows. The short-term swing pivot trend has shifted to an uptrend, but all benchmark moving averages from short to long-term remain in a downtrend, reflecting persistent bearish pressure over the past months. The weekly session fib grid (WSFG) trend is down with price below the NTZ, suggesting short-term weakness, while the monthly (MSFG) and yearly (YSFG) session fib grids both show price above their NTZs and an uptrend, hinting at a possible intermediate and long-term recovery. Swing pivot resistance levels are stacked above, with the nearest support at 0.0066615, which recently held during the latest sell-off. Recent trade signals show a mix of short and long entries, reflecting the choppy, transitional nature of the current market. Volatility remains elevated (ATR 118), and volume is robust. Overall, the market is in a short-term neutral phase with potential for further upside retracement, but intermediate-term structure remains bearish until key resistance levels are reclaimed. Long-term outlook is turning bullish as higher time frame trends begin to shift, but confirmation is still needed.
Chart Analysis ATS AI Generated: 2025-08-04 07:03 for Informational use only, not trading advice. Terms and Risk Disclosure Copyright © 2025. Algo Trading Systems LLC.
