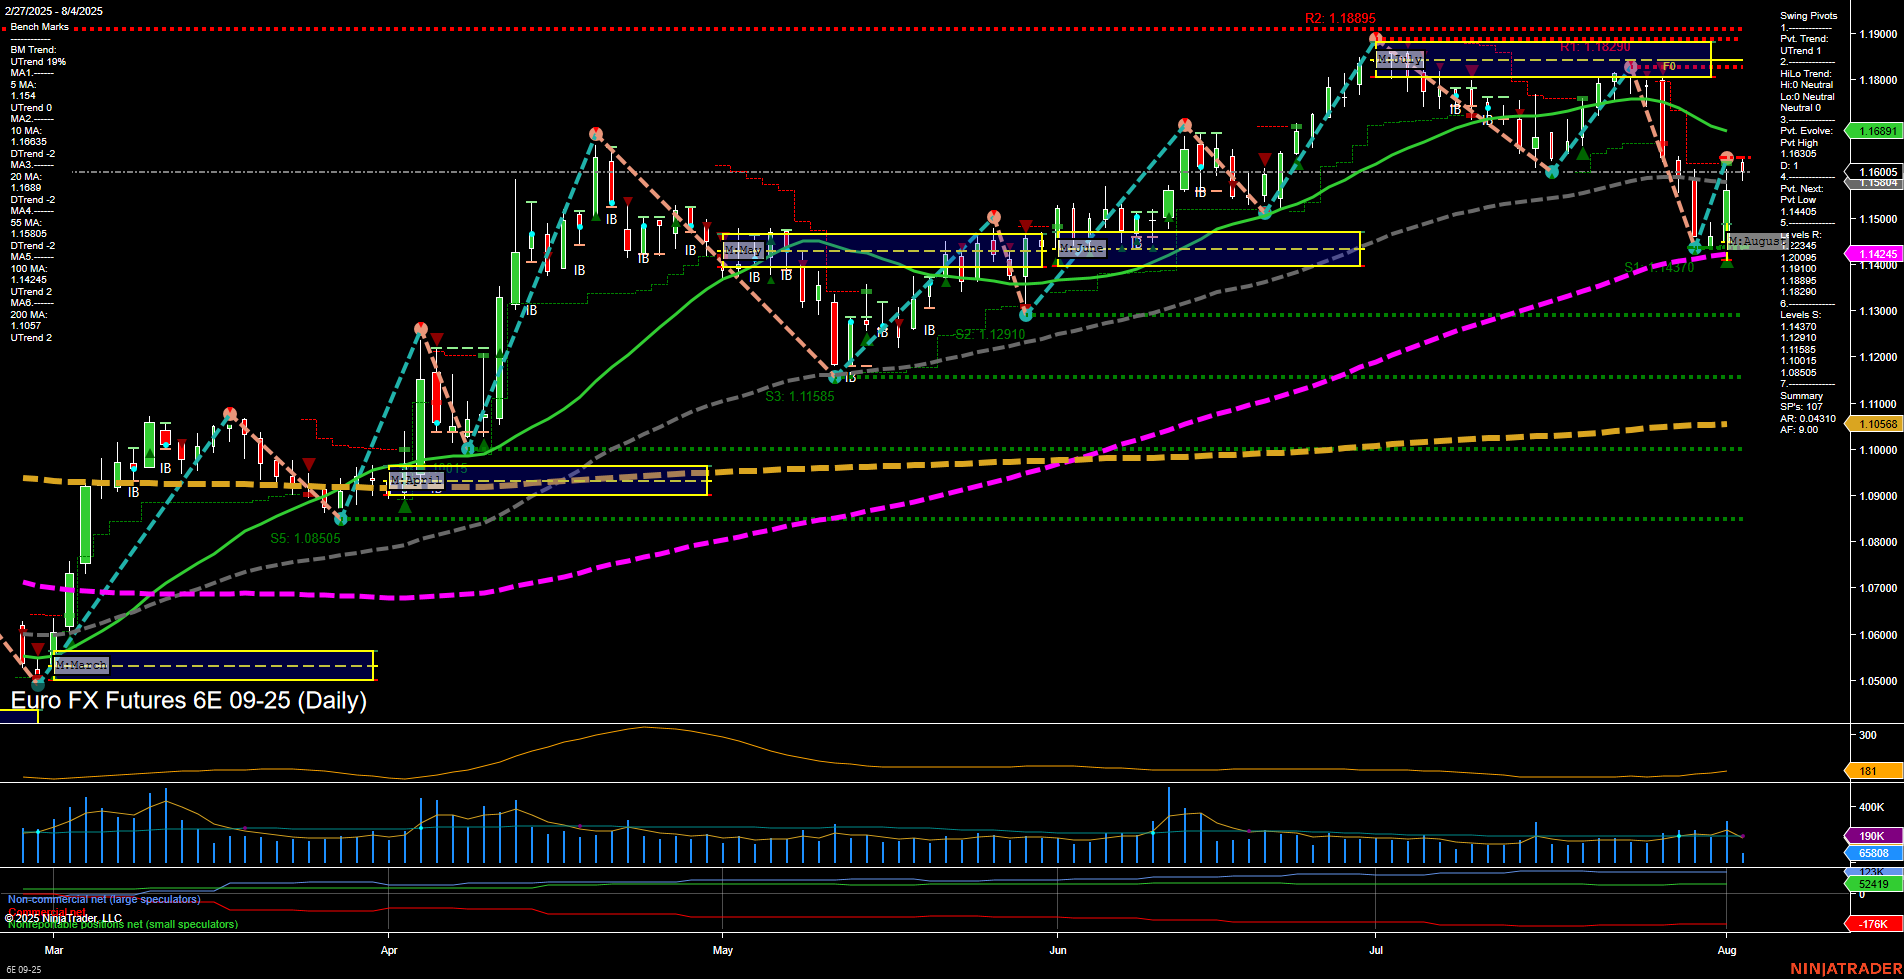
6E Euro FX Futures Daily Chart Analysis: 2025-Aug-04 07:01 CT
Price Action
- Last: 1.16005,
- Bars: Medium,
- Mom: Average.
WSFG Weekly
- Short-Term
- WSFG Current: -10%
- F0%/NTZ' Bias: Price Below,
- WSFG Trend: Down.
MSFG Month Aug
- Intermediate-Term
- MSFG Current: 31%
- F0%/NTZ' Bias: Price Above,
- MSFG Trend: Up.
YSFG Year 2025
- Long-Term
- YSFG Current: 77%
- F0%/NTZ' Bias: Price Above,
- YSFG Trend: Up.
Swing Pivots
- (Short-Term) 1. Pvt. Trend: UTrend,
- (Intermediate-Term) 2. HiLo Trend: UTrend,
- 3. Pvt. Evolve: Pvt High 1.16035,
- 4. Pvt. Next: Pvt Low 1.14405,
- 5. Levels R: 1.18895, 1.18210, 1.17510, 1.16895, 1.16035,
- 6. Levels S: 1.14405, 1.12910, 1.11585, 1.10855, 1.10565.
Daily Benchmarks
- (Short-Term) 5 Day: 1.154 Up Trend,
- (Short-Term) 10 Day: 1.158 Up Trend,
- (Intermediate-Term) 20 Day: 1.169 Up Trend,
- (Intermediate-Term) 55 Day: 1.144 Up Trend,
- (Long-Term) 100 Day: 1.161 Up Trend,
- (Long-Term) 200 Day: 1.106 Up Trend.
Additional Metrics
Recent Trade Signals
- 01 Aug 2025: Long 6E 09-25 @ 1.1587 Signals.USAR.TR120
- 29 Jul 2025: Short 6E 09-25 @ 1.162 Signals.USAR.TR720
- 28 Jul 2025: Short 6E 09-25 @ 1.17795 Signals.USAR-MSFG
Overall Rating
- Short-Term: Bullish,
- Intermediate-Term: Bullish,
- Long-Term: Bullish.
Key Insights Summary
The 6E Euro FX Futures daily chart shows a market that has recently experienced a sharp pullback but is now rebounding off support, with the last price at 1.16005. Price action is medium in size with average momentum, suggesting a transition phase after recent volatility. The short-term WSFG trend is down, but price has moved above the monthly and yearly session fib grid centers, indicating underlying strength on higher timeframes. All benchmark moving averages from short to long term are in uptrends, reinforcing a bullish bias across the board. Swing pivot analysis confirms an uptrend in both short and intermediate terms, with the most recent pivot high at 1.16035 and key support at 1.14405. Recent trade signals show a mix of short and long entries, reflecting the choppy nature of the recent price action, but the latest signal is long, aligning with the broader uptrend. Volatility remains elevated (ATR 168), and volume is robust, supporting the potential for continued movement. Overall, the market is in a bullish structure on all major timeframes, with the recent pullback potentially setting the stage for a continuation higher if support holds and momentum builds.
Chart Analysis ATS AI Generated: 2025-08-04 07:02 for Informational use only, not trading advice. Terms and Risk Disclosure Copyright © 2025. Algo Trading Systems LLC.
