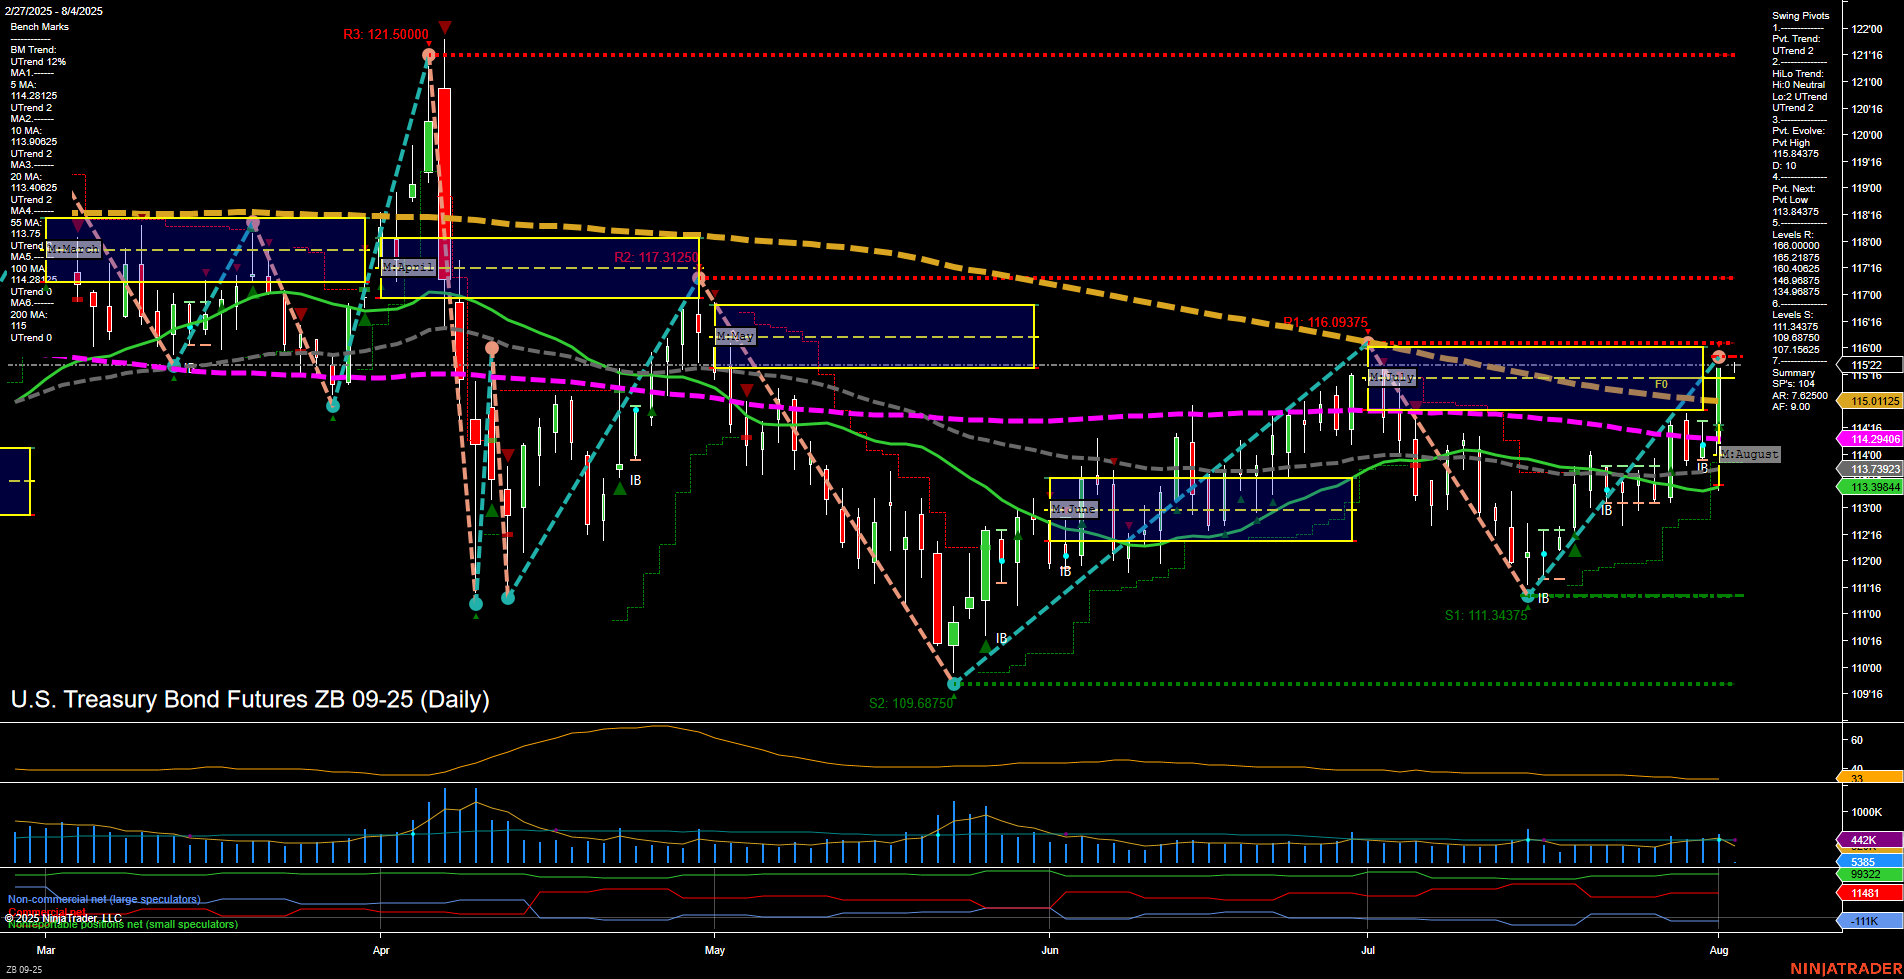
The ZB U.S. Treasury Bond Futures daily chart currently reflects a constructive environment for swing traders, with both short-term and intermediate-term trends in an uptrend, as confirmed by the swing pivot structure and the alignment of all key moving averages (except the 200-day, which remains in a downtrend). Price is consolidating just below a significant resistance cluster (115.84375–116.09375), with the most recent swing high acting as a near-term ceiling. The ATR and volume metrics suggest moderate volatility and healthy participation. The neutral stance of the session fib grids (weekly, monthly, yearly) indicates a lack of strong directional bias from broader timeframes, but the prevailing uptrend in pivots and benchmarks supports a bullish short- and intermediate-term outlook. The market is in a recovery phase from the June lows, with higher lows and a series of inside bars signaling potential for further upside if resistance is cleared. However, the 200-day MA overhead and the proximity to resistance levels may lead to some consolidation or choppy price action before a decisive breakout. Overall, the technical structure favors trend continuation, but traders should be attentive to any signs of reversal near resistance.