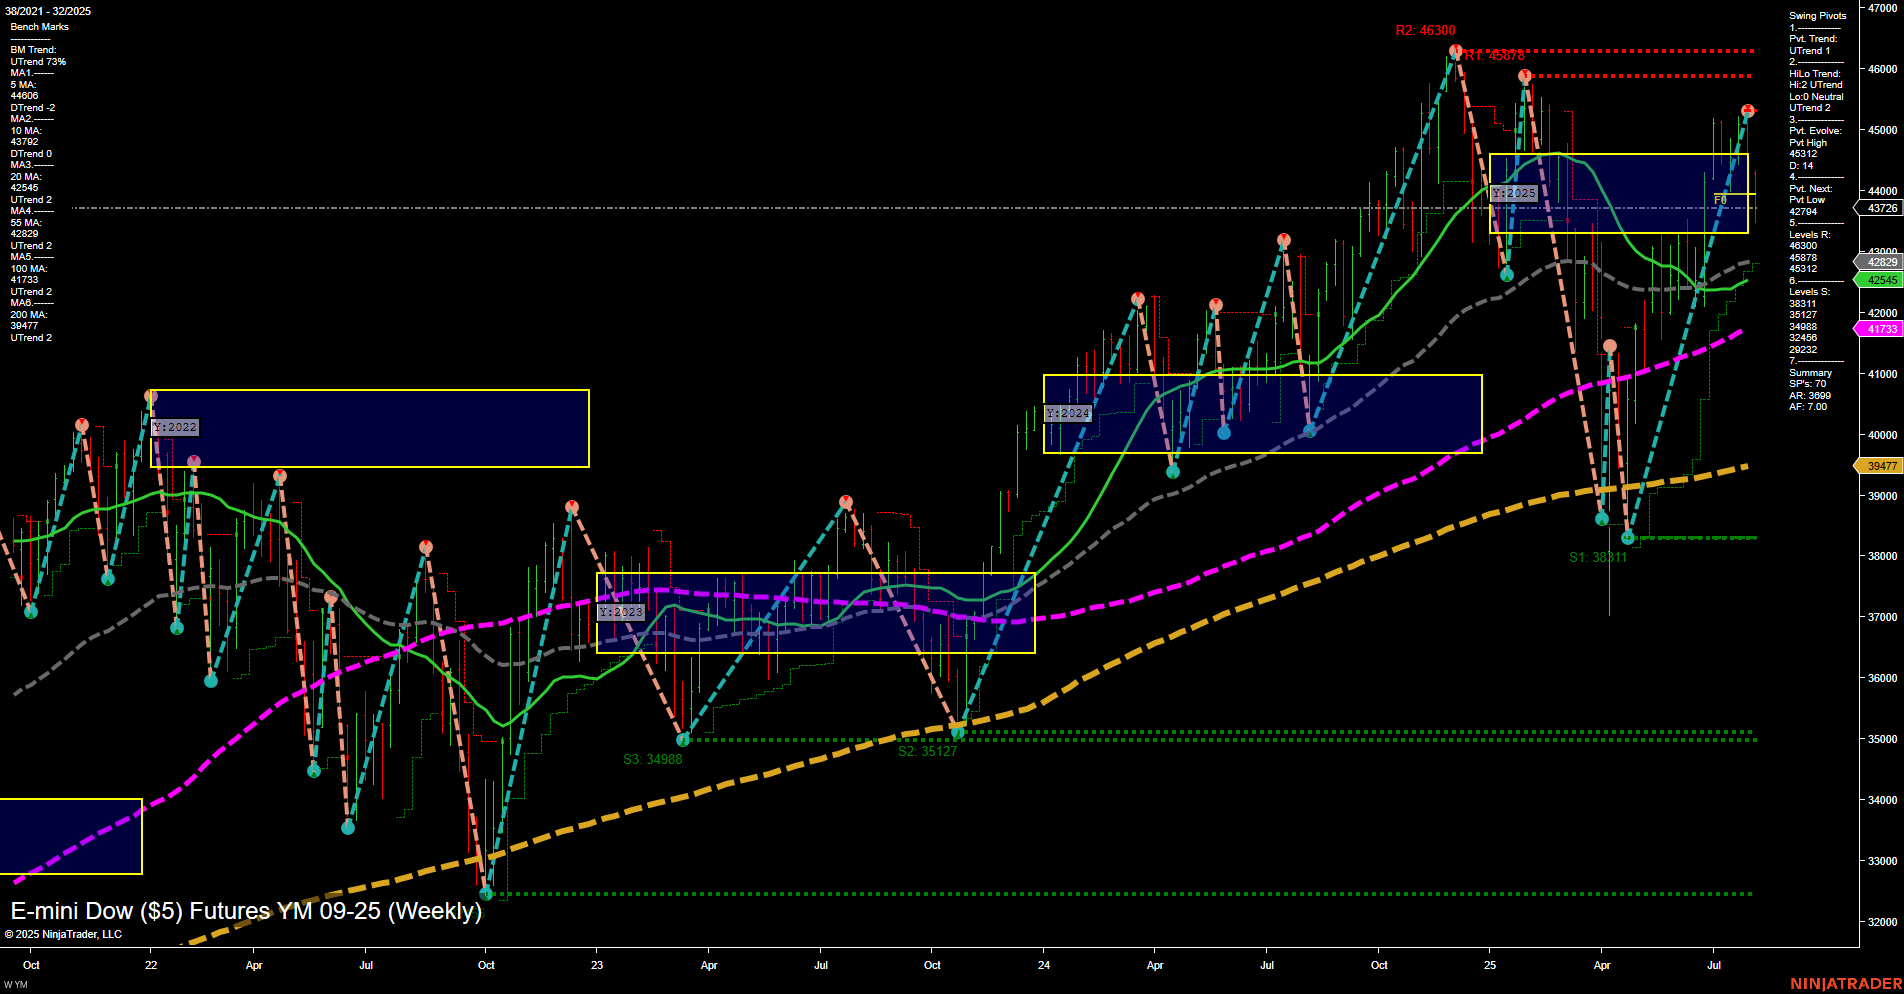
YM E-mini Dow ($5) Futures Weekly Chart Analysis: 2025-Aug-03 18:13 CT
Price Action
- Last: 43726,
- Bars: Large,
- Mom: Momentum fast.
WSFG Weekly
- Short-Term
- WSFG Current: 4%
- F0%/NTZ' Bias: Price Above,
- WSFG Trend: Up.
MSFG Month Aug
- Intermediate-Term
- MSFG Current: -20%
- F0%/NTZ' Bias: Price Below,
- MSFG Trend: Down.
YSFG Year 2025
- Long-Term
- YSFG Current: -3%
- F0%/NTZ' Bias: Price Below,
- YSFG Trend: Down.
Swing Pivots
- (Short-Term) 1. Pvt. Trend: DTrend,
- (Intermediate-Term) 2. HiLo Trend: UTrend,
- 3. Pvt. Evolve: Pvt high 46312,
- 4. Pvt. Next: Pvt low 42704,
- 5. Levels R: 46300, 45878, 46312,
- 6. Levels S: 42704, 38311, 35127, 34988.
Weekly Benchmarks
- (Intermediate-Term) 5 Week: 44060 Down Trend,
- (Intermediate-Term) 10 Week: 43722 Down Trend,
- (Long-Term) 20 Week: 42545 Up Trend,
- (Long-Term) 55 Week: 41733 Up Trend,
- (Long-Term) 100 Week: 42295 Up Trend,
- (Long-Term) 200 Week: 39477 Up Trend.
Recent Trade Signals
- 01 Aug 2025: Short YM 09-25 @ 43919 Signals.USAR-MSFG
- 01 Aug 2025: Short YM 09-25 @ 44238 Signals.USAR.TR720
- 29 Jul 2025: Short YM 09-25 @ 45069 Signals.USAR-WSFG
- 28 Jul 2025: Short YM 09-25 @ 44957 Signals.USAR.TR120
Overall Rating
- Short-Term: Bearish,
- Intermediate-Term: Neutral,
- Long-Term: Bullish.
Key Insights Summary
The YM E-mini Dow futures weekly chart shows a market in transition. Price action is volatile with large bars and fast momentum, reflecting recent sharp moves. Short-term signals and the WSFG trend are bearish, with price recently breaking below key short-term moving averages and swing pivots shifting to a downtrend. Intermediate-term signals are mixed: the monthly fib grid trend is down, but the HiLo swing trend remains up, suggesting a possible tug-of-war between buyers and sellers. Long-term structure remains bullish, as all major long-term moving averages are trending up and price is still well above the 200-week benchmark. Key resistance is clustered near recent highs (46300–46312), while support is layered below at 42704 and further down at 38311 and 35127. Recent trade signals have favored the short side, indicating a corrective phase or pullback within a broader uptrend. The market is currently testing the lower end of its recent range, and the next swing pivot low at 42704 will be critical for determining if the pullback deepens or if buyers step in to defend the long-term trend.
Chart Analysis ATS AI Generated: 2025-08-03 18:13 for Informational use only, not trading advice. Terms and Risk Disclosure Copyright © 2025. Algo Trading Systems LLC.
