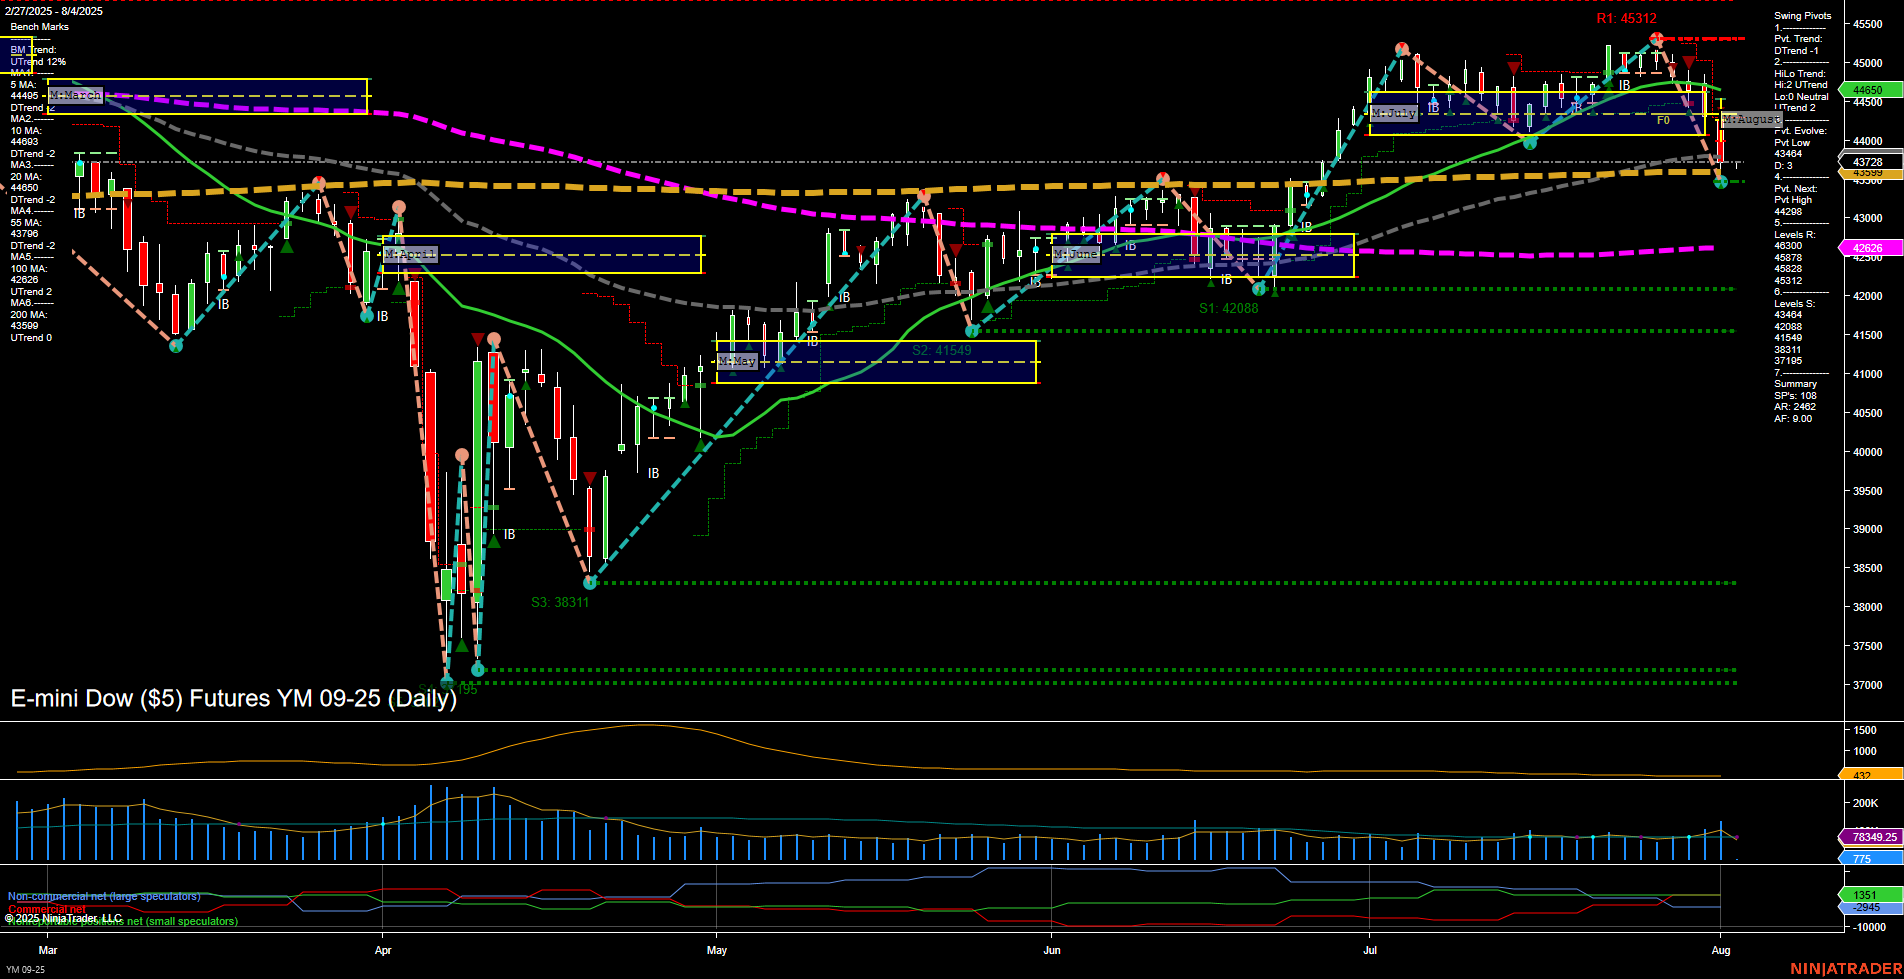
YM E-mini Dow ($5) Futures Daily Chart Analysis: 2025-Aug-03 18:13 CT
Price Action
- Last: 43,726,
- Bars: Medium,
- Mom: Momentum slow.
WSFG Weekly
- Short-Term
- WSFG Current: 4%
- F0%/NTZ' Bias: Price Above,
- WSFG Trend: Up.
MSFG Month Aug
- Intermediate-Term
- MSFG Current: -20%
- F0%/NTZ' Bias: Price Below,
- MSFG Trend: Down.
YSFG Year 2025
- Long-Term
- YSFG Current: -3%
- F0%/NTZ' Bias: Price Below,
- YSFG Trend: Down.
Swing Pivots
- (Short-Term) 1. Pvt. Trend: DTrend,
- (Intermediate-Term) 2. HiLo Trend: UTrend,
- 3. Pvt. Evolve: Pvt Low 43,404,
- 4. Pvt. Next: Pvt High 44,288,
- 5. Levels R: 45,312, 44,288, 43,878,
- 6. Levels S: 43,404, 41,549, 38,311.
Daily Benchmarks
- (Short-Term) 5 Day: 44,065 Down Trend,
- (Short-Term) 10 Day: 44,680 Down Trend,
- (Intermediate-Term) 20 Day: 44,560 Neutral,
- (Intermediate-Term) 55 Day: 43,266 Up Trend,
- (Long-Term) 100 Day: 42,626 Up Trend,
- (Long-Term) 200 Day: 41,220 Up Trend.
Additional Metrics
- ATR: 512,
- VOLMA: 108,292.
Recent Trade Signals
- 01 Aug 2025: Short YM 09-25 @ 43,919 Signals.USAR-MSFG
- 01 Aug 2025: Short YM 09-25 @ 44,238 Signals.USAR.TR720
- 29 Jul 2025: Short YM 09-25 @ 45,069 Signals.USAR-WSFG
- 28 Jul 2025: Short YM 09-25 @ 44,957 Signals.USAR.TR120
Overall Rating
- Short-Term: Bearish,
- Intermediate-Term: Neutral,
- Long-Term: Bearish.
Key Insights Summary
The YM E-mini Dow futures are currently experiencing a shift in momentum, with the short-term trend turning bearish as indicated by the recent swing pivot downtrend and a series of short trade signals. Price has broken below the monthly session fib grid (MSFG) neutral zone, confirming intermediate-term weakness, while the weekly session fib grid (WSFG) still shows some residual short-term strength. The daily moving averages for 5 and 10 days have turned down, reinforcing the short-term bearish outlook, while the 20-day is neutral and longer-term averages remain in uptrends, suggesting underlying support but with weakening momentum. Volatility is moderate, and volume remains robust, indicating active participation during this pullback. The market is testing key support at 43,404, with further downside risk toward 41,549 if selling persists. The overall structure suggests a corrective phase within a broader consolidation, with the potential for further downside unless buyers step in at support levels. The recent cluster of short signals and the alignment of technicals point to a cautious stance, with the market at a critical juncture between continuation of the pullback and possible stabilization.
Chart Analysis ATS AI Generated: 2025-08-03 18:13 for Informational use only, not trading advice. Terms and Risk Disclosure Copyright © 2025. Algo Trading Systems LLC.
