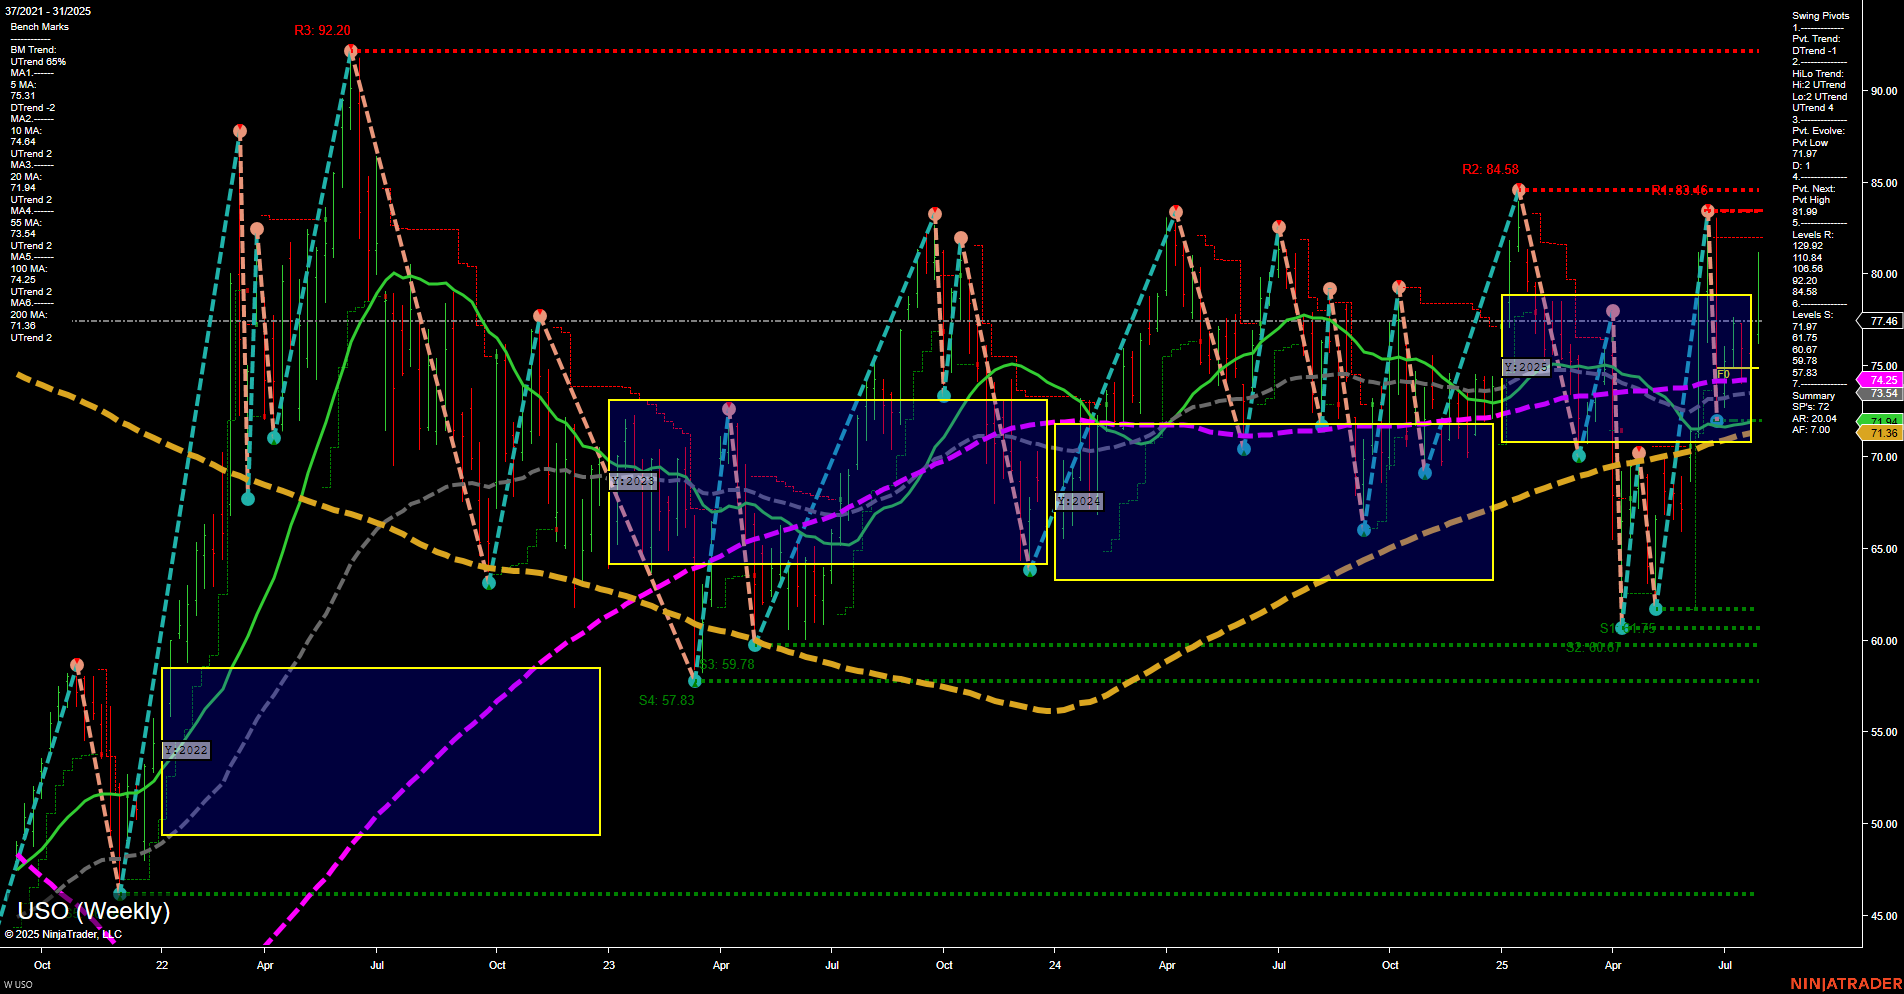
USO United States Oil Fund LP Weekly Chart Analysis: 2025-Aug-03 18:13 CT
Price Action
- Last: 77.46,
- Bars: Large,
- Mom: Momentum fast.
WSFG Weekly
- Short-Term
- WSFG Current: NA%
- F0%/NTZ' Bias: Price Neutral,
- WSFG Trend: Neutral.
MSFG Month Aug
- Intermediate-Term
- MSFG Current: NA%
- F0%/NTZ' Bias: Price Neutral,
- MSFG Trend: Neutral.
YSFG Year 2025
- Long-Term
- YSFG Current: NA%
- F0%/NTZ' Bias: Price Neutral,
- YSFG Trend: Neutral.
Swing Pivots
- (Short-Term) 1. Pvt. Trend: DTrend,
- (Intermediate-Term) 2. HiLo Trend: UTrend,
- 3. Pvt. Evolve: Pvt low 61.75,
- 4. Pvt. Next: Pvt high 84.85,
- 5. Levels R: 92.20, 84.85, 83.46, 84.58,
- 6. Levels S: 61.75, 59.78, 57.83.
Weekly Benchmarks
- (Intermediate-Term) 5 Week: 75.31 Up Trend,
- (Intermediate-Term) 10 Week: 74.64 Up Trend,
- (Long-Term) 20 Week: 77.13 Up Trend,
- (Long-Term) 55 Week: 71.36 Up Trend,
- (Long-Term) 100 Week: 74.25 Down Trend,
- (Long-Term) 200 Week: 73.54 Up Trend.
Overall Rating
- Short-Term: Bearish,
- Intermediate-Term: Bullish,
- Long-Term: Neutral.
Key Insights Summary
The USO weekly chart shows a market in transition, with recent price action marked by large, fast-moving bars indicating heightened volatility. The short-term swing pivot trend is down, suggesting recent selling pressure, but the intermediate-term HiLo trend remains up, reflecting underlying resilience. Price is currently near the upper end of the recent range, having rebounded sharply from a major swing low at 61.75, but faces significant resistance at 84.85 and above. Most benchmark moving averages are trending up, except for the 100-week, which is still in a downtrend, highlighting a mixed long-term outlook. The neutral stance of the session fib grids across all timeframes points to a market consolidating after a volatile move, with no clear directional bias from the grid structure. Overall, the chart suggests a choppy environment with potential for further range-bound action between major support and resistance levels, as the market digests recent swings and awaits a catalyst for a sustained breakout or breakdown.
Chart Analysis ATS AI Generated: 2025-08-03 18:13 for Informational use only, not trading advice. Terms and Risk Disclosure Copyright © 2025. Algo Trading Systems LLC.
