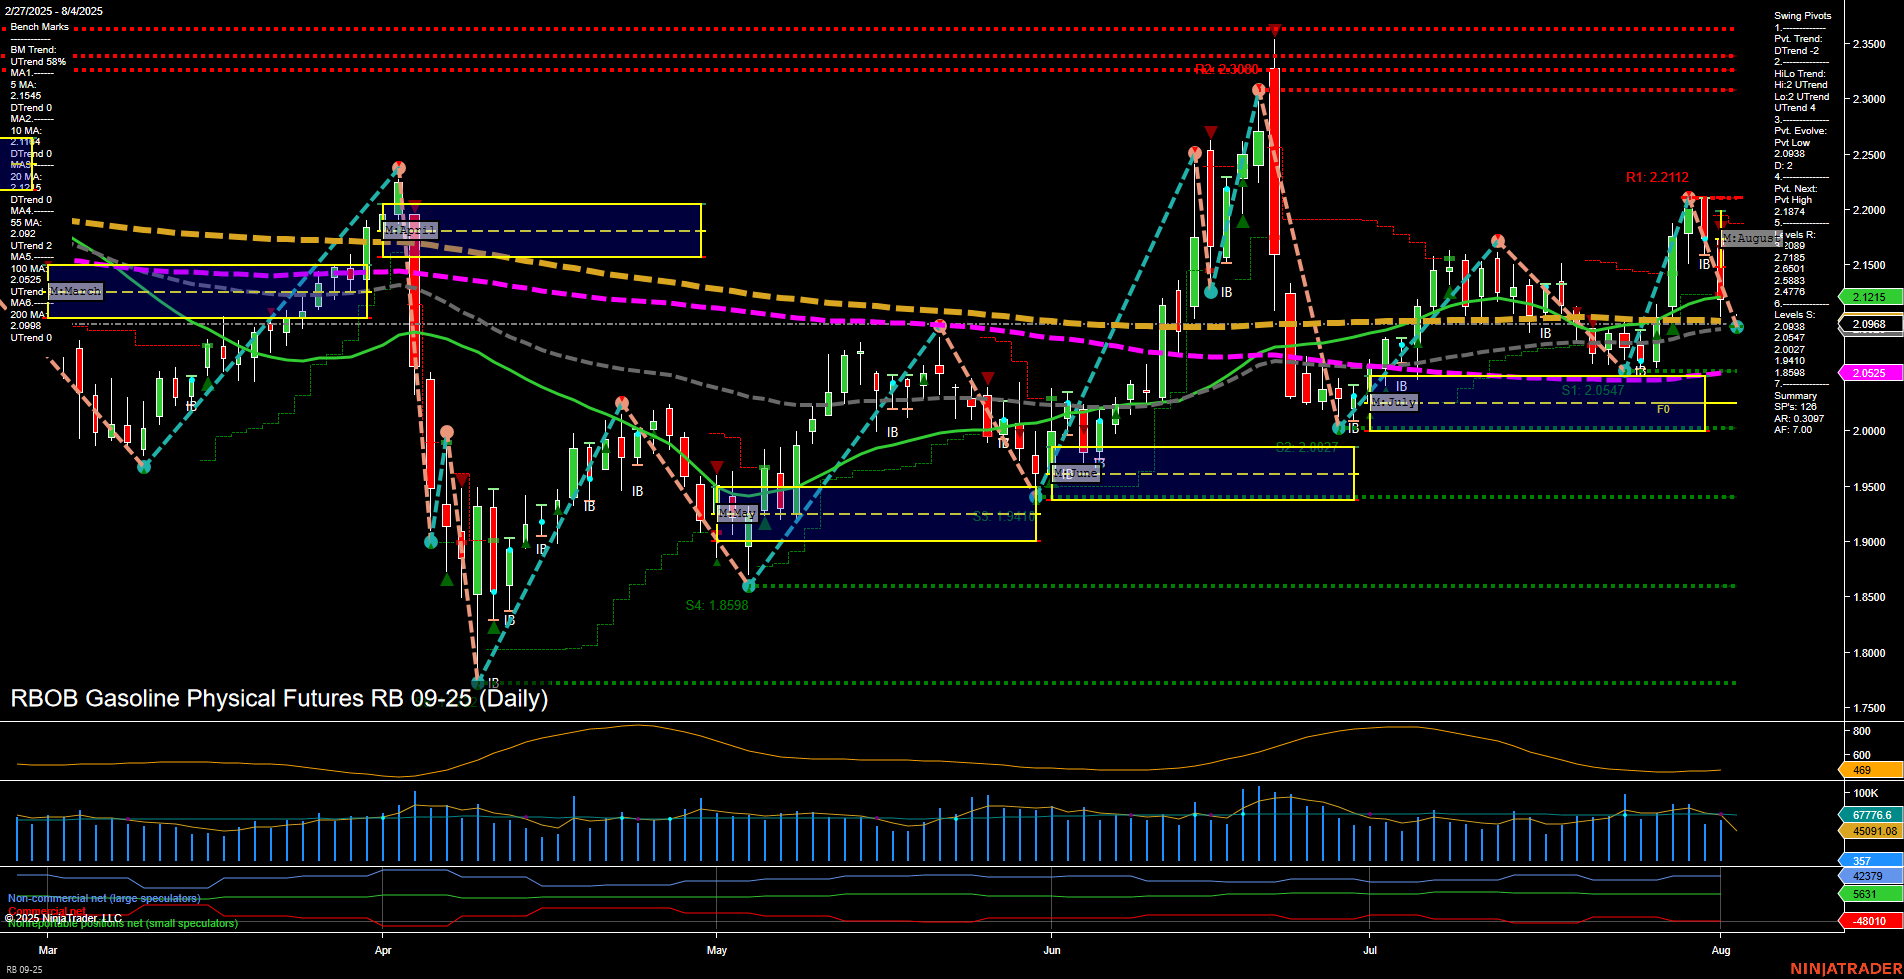
RB RBOB Gasoline Physical Futures Daily Chart Analysis: 2025-Aug-03 18:09 CT
Price Action
- Last: 2.0968,
- Bars: Medium,
- Mom: Momentum slow.
WSFG Weekly
- Short-Term
- WSFG Current: -12%
- F0%/NTZ' Bias: Price Below,
- WSFG Trend: Down.
MSFG Month Aug
- Intermediate-Term
- MSFG Current: -26%
- F0%/NTZ' Bias: Price Below,
- MSFG Trend: Down.
YSFG Year 2025
- Long-Term
- YSFG Current: -2%
- F0%/NTZ' Bias: Price Below,
- YSFG Trend: Down.
Swing Pivots
- (Short-Term) 1. Pvt. Trend: DTrend,
- (Intermediate-Term) 2. HiLo Trend: UTrend,
- 3. Pvt. Evolve: Pvt Low 2.0938,
- 4. Pvt. Next: Pvt High 2.1874,
- 5. Levels R: 2.2211, 2.1874, 2.1685, 2.1545, 2.1453, 2.0938,
- 6. Levels S: 2.0547, 1.9698, 1.8559.
Daily Benchmarks
- (Short-Term) 5 Day: 2.1545 Down Trend,
- (Short-Term) 10 Day: 2.1453 Down Trend,
- (Intermediate-Term) 20 Day: 2.1215 Down Trend,
- (Intermediate-Term) 55 Day: 2.0525 Up Trend,
- (Long-Term) 100 Day: 2.0622 Up Trend,
- (Long-Term) 200 Day: 2.0908 Up Trend.
Additional Metrics
Recent Trade Signals
- 01 Aug 2025: Short RB 09-25 @ 2.1338 Signals.USAR-MSFG
- 31 Jul 2025: Short RB 09-25 @ 2.1674 Signals.USAR.TR120
Overall Rating
- Short-Term: Bearish,
- Intermediate-Term: Bearish,
- Long-Term: Neutral.
Key Insights Summary
RBOB Gasoline futures are currently exhibiting a bearish short-term and intermediate-term structure, with price action below all key session fib grid levels (weekly, monthly, yearly) and the majority of short-term and intermediate-term moving averages trending down. The most recent swing pivot trend is down, with the next potential reversal only above 2.1874, while resistance levels cluster above current price and support sits lower at 2.0547 and 1.9698. The long-term moving averages are still holding an uptrend, but price is now testing these levels, suggesting a possible inflection point. Recent trade signals confirm a short bias, and momentum remains slow with moderate volatility. The market appears to be in a corrective phase after a failed attempt to break higher, with a series of lower highs and lower lows forming. The overall environment is one of downside pressure, with the potential for further declines unless a strong reversal develops above key resistance.
Chart Analysis ATS AI Generated: 2025-08-03 18:10 for Informational use only, not trading advice. Terms and Risk Disclosure Copyright © 2025. Algo Trading Systems LLC.
