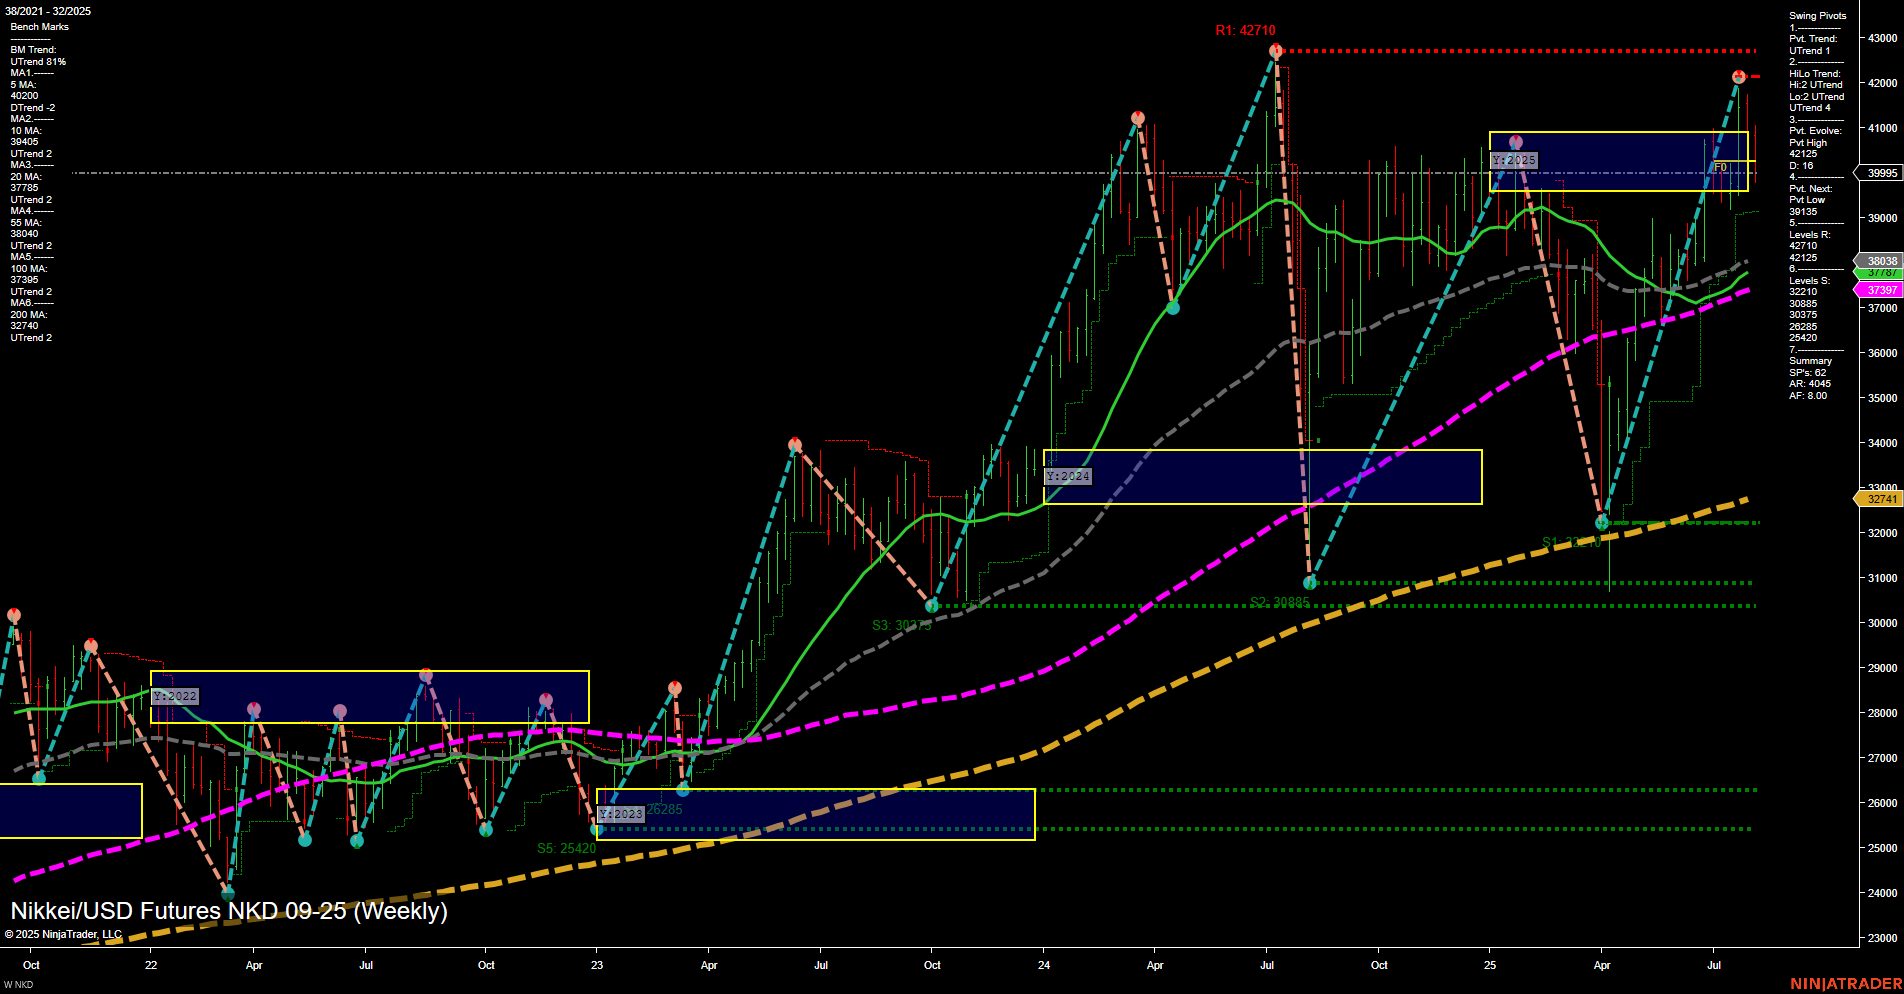
NKD Nikkei/USD Futures Weekly Chart Analysis: 2025-Aug-03 18:08 CT
Price Action
- Last: 40,835,
- Bars: Large,
- Mom: Momentum fast.
WSFG Weekly
- Short-Term
- WSFG Current: 2%
- F0%/NTZ' Bias: Price Above,
- WSFG Trend: Up.
MSFG Month Aug
- Intermediate-Term
- MSFG Current: -25%
- F0%/NTZ' Bias: Price Below,
- MSFG Trend: Down.
YSFG Year 2025
- Long-Term
- YSFG Current: -4%
- F0%/NTZ' Bias: Price Below,
- YSFG Trend: Down.
Swing Pivots
- (Short-Term) 1. Pvt. Trend: UTrend,
- (Intermediate-Term) 2. HiLo Trend: UTrend,
- 3. Pvt. Evolve: Pvt high 42,615,
- 4. Pvt. Next: Pvt low 39,915,
- 5. Levels R: 42,715, 42,615, 41,215,
- 6. Levels S: 39,915, 38,875, 37,395, 32,875, 32,065, 30,875, 25,420.
Weekly Benchmarks
- (Intermediate-Term) 5 Week: 40,200 Up Trend,
- (Intermediate-Term) 10 Week: 39,045 Up Trend,
- (Long-Term) 20 Week: 37,765 Up Trend,
- (Long-Term) 55 Week: 35,840 Up Trend,
- (Long-Term) 100 Week: 37,965 Up Trend,
- (Long-Term) 200 Week: 32,740 Up Trend.
Recent Trade Signals
- 01 Aug 2025: Short NKD 09-25 @ 40745 Signals.USAR.TR120
- 31 Jul 2025: Long NKD 09-25 @ 41130 Signals.USAR-MSFG
Overall Rating
- Short-Term: Bullish,
- Intermediate-Term: Neutral,
- Long-Term: Bullish.
Key Insights Summary
The NKD Nikkei/USD futures weekly chart shows strong bullish momentum in the short term, with price action breaking above the weekly session fib grid (WSFG) neutral zone and all key moving averages trending upward. The most recent swing pivots confirm an uptrend, with resistance levels being tested near all-time highs. However, the intermediate-term (monthly) trend is neutral to slightly bearish, as indicated by the MSFG and a recent short signal, suggesting some caution around potential pullbacks or consolidation. Long-term structure remains robustly bullish, supported by all major moving averages and higher lows on the chart. The market is currently in a phase of high volatility, with large bars and fast momentum, indicating active participation and possible trend continuation, but also the risk of sharp retracements. The overall technical landscape favors the bulls, but the mixed signals in the intermediate term highlight the potential for choppy price action or a pause before the next major move.
Chart Analysis ATS AI Generated: 2025-08-03 18:08 for Informational use only, not trading advice. Terms and Risk Disclosure Copyright © 2025. Algo Trading Systems LLC.
