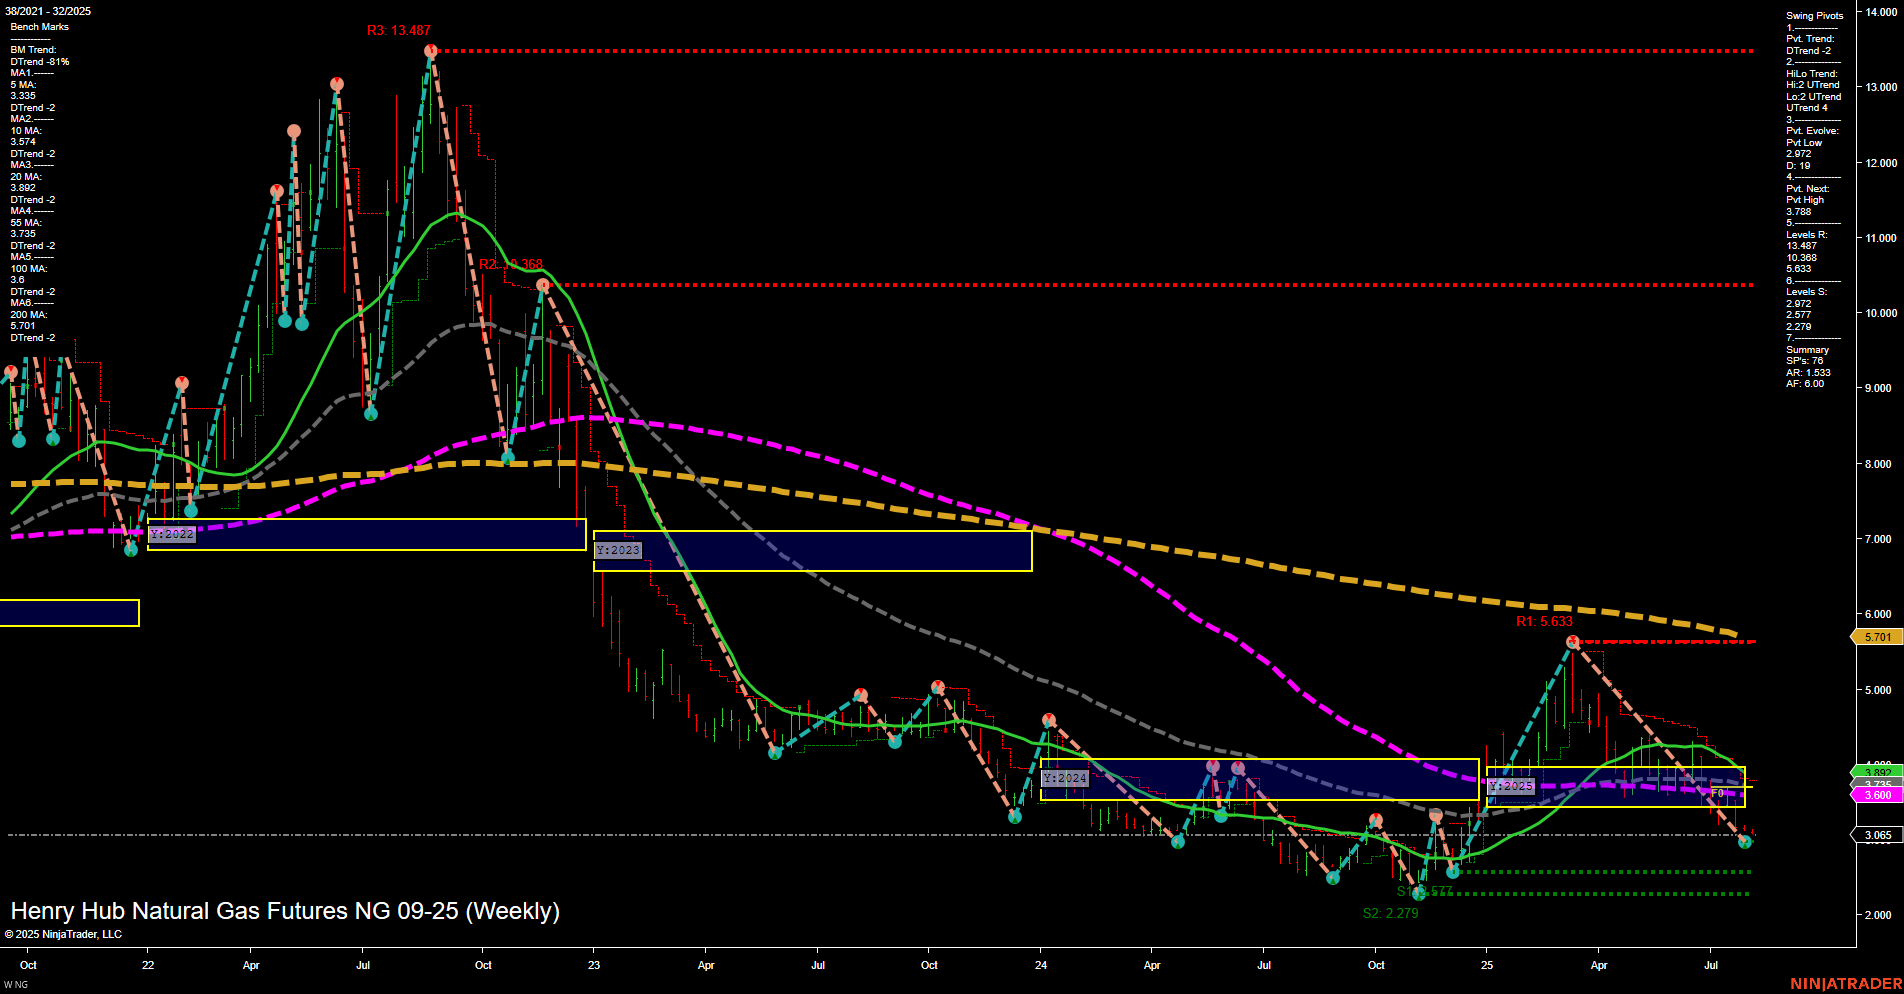
NG Henry Hub Natural Gas Futures Weekly Chart Analysis: 2025-Aug-03 18:08 CT
Price Action
- Last: 3.065,
- Bars: Medium,
- Mom: Momentum slow.
WSFG Weekly
- Short-Term
- WSFG Current: NA%
- F0%/NTZ' Bias: Price Neutral,
- WSFG Trend: Neutral.
MSFG Month Aug
- Intermediate-Term
- MSFG Current: NA%
- F0%/NTZ' Bias: Price Neutral,
- MSFG Trend: Neutral.
YSFG Year 2025
- Long-Term
- YSFG Current: NA%
- F0%/NTZ' Bias: Price Neutral,
- YSFG Trend: Neutral.
Swing Pivots
- (Short-Term) 1. Pvt. Trend: DTrend,
- (Intermediate-Term) 2. HiLo Trend: UTrend,
- 3. Pvt. Evolve: Pvt low 2.172,
- 4. Pvt. Next: Pvt high 3.788,
- 5. Levels R: 13.487, 10.338, 6.633, 5.633,
- 6. Levels S: 2.279, 2.172.
Weekly Benchmarks
- (Intermediate-Term) 5 Week: 3.334 Down Trend,
- (Intermediate-Term) 10 Week: 3.174 Down Trend,
- (Long-Term) 20 Week: 3.600 Down Trend,
- (Long-Term) 55 Week: 5.745 Down Trend,
- (Long-Term) 100 Week: 7.902 Down Trend,
- (Long-Term) 200 Week: 10.710 Down Trend.
Recent Trade Signals
- 31 Jul 2025: Long NG 09-25 @ 3.1 Signals.USAR.TR120
Overall Rating
- Short-Term: Bearish,
- Intermediate-Term: Neutral,
- Long-Term: Bearish.
Key Insights Summary
Natural gas futures remain under pressure, with the last price at 3.065 and slow momentum reflected in medium-sized bars. The short-term swing pivot trend is down, and all key moving averages (5, 10, 20, 55, 100, 200 week) are trending lower, confirming a persistent bearish environment. The intermediate-term HiLo trend shows some upward movement, suggesting a possible attempt at stabilization or a corrective bounce, but this is not yet supported by the benchmarks or the overall price structure. Major resistance levels are far above current price, while support is clustered just below, indicating a market that is consolidating near its lows after a prolonged decline. The recent long signal may reflect a tactical bounce attempt, but the broader context remains weak. Overall, the chart suggests a market in a long-term downtrend, with short-term and long-term outlooks bearish, and only the intermediate-term showing signs of neutrality as the market digests recent lows.
Chart Analysis ATS AI Generated: 2025-08-03 18:08 for Informational use only, not trading advice. Terms and Risk Disclosure Copyright © 2025. Algo Trading Systems LLC.
