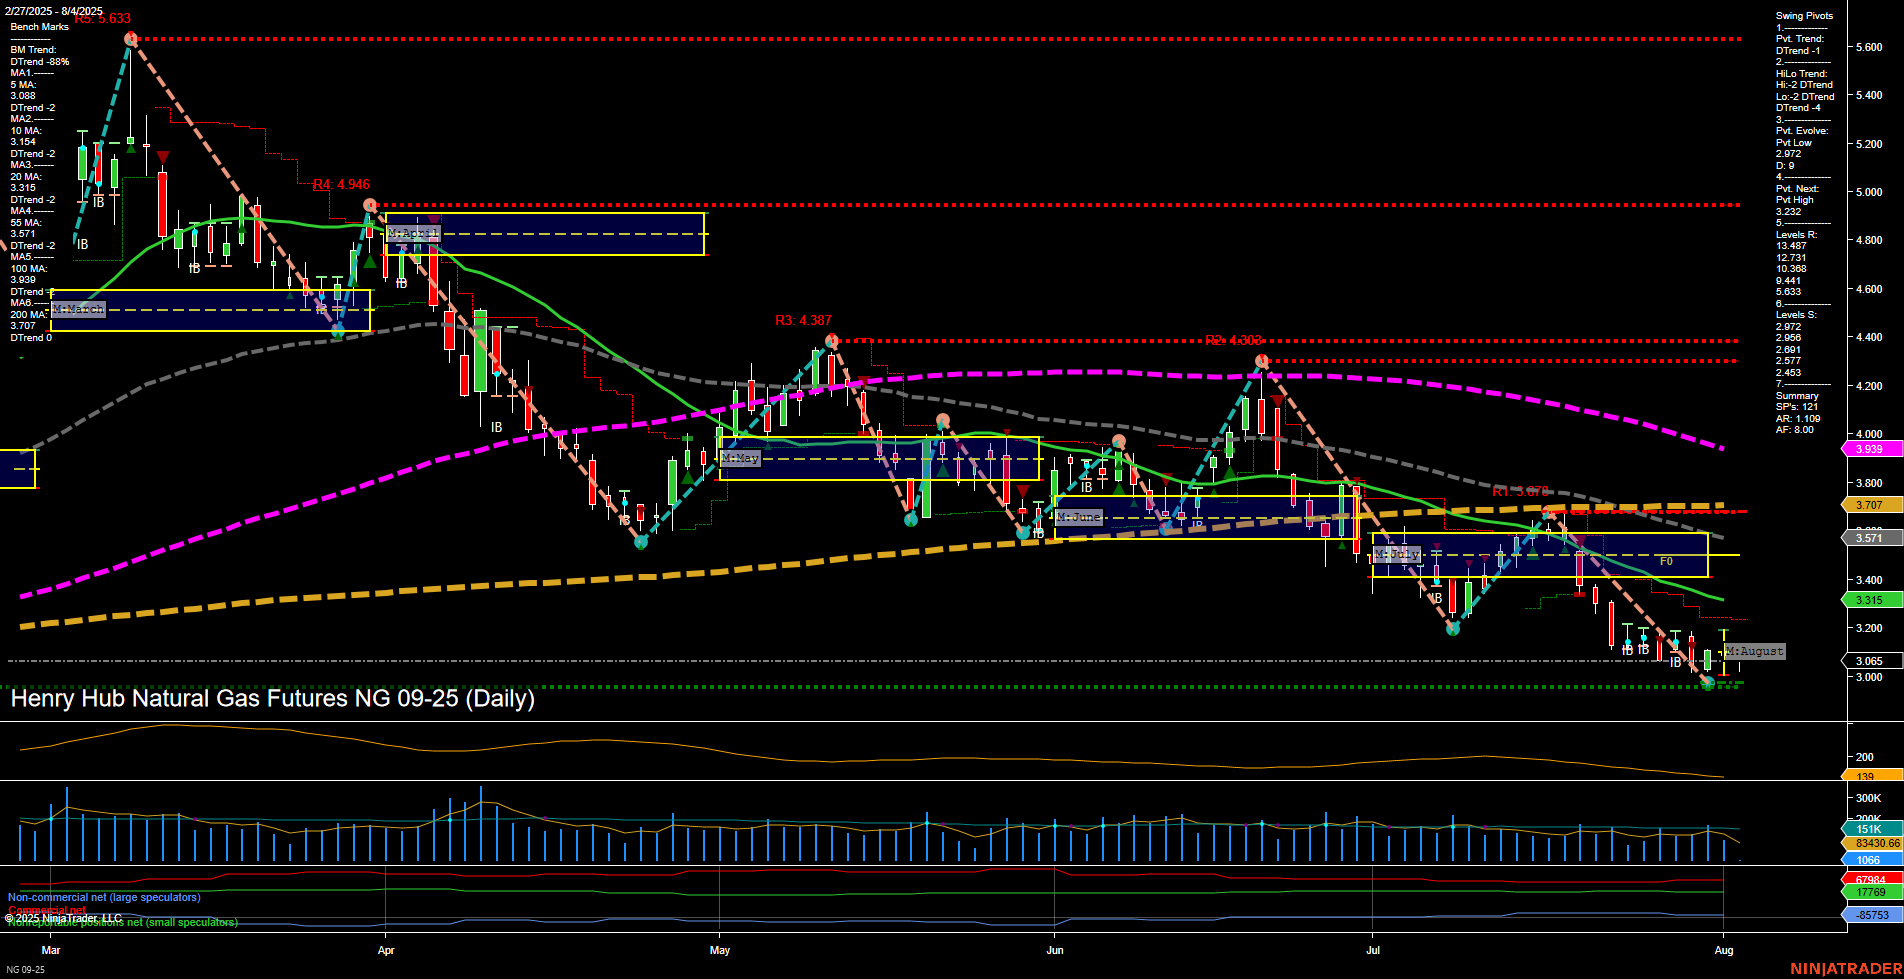
NG Henry Hub Natural Gas Futures Daily Chart Analysis: 2025-Aug-03 18:07 CT
Price Action
- Last: 3.065,
- Bars: Small,
- Mom: Momentum slow.
WSFG Weekly
- Short-Term
- WSFG Current: NA%
- F0%/NTZ' Bias: Price Neutral,
- WSFG Trend: Neutral.
MSFG Month Aug
- Intermediate-Term
- MSFG Current: NA%
- F0%/NTZ' Bias: Price Neutral,
- MSFG Trend: Neutral.
YSFG Year 2025
- Long-Term
- YSFG Current: NA%
- F0%/NTZ' Bias: Price Neutral,
- YSFG Trend: Neutral.
Swing Pivots
- (Short-Term) 1. Pvt. Trend: DTrend,
- (Intermediate-Term) 2. HiLo Trend: DTrend,
- 3. Pvt. Evolve: Pvt low 3.065,
- 4. Pvt. Next: Pvt high 3.232,
- 5. Levels R: 4.948, 4.430, 4.387, 3.232,
- 6. Levels S: 3.065.
Daily Benchmarks
- (Short-Term) 5 Day: 3.088 Down Trend,
- (Short-Term) 10 Day: 3.154 Down Trend,
- (Intermediate-Term) 20 Day: 3.315 Down Trend,
- (Intermediate-Term) 55 Day: 3.707 Down Trend,
- (Long-Term) 100 Day: 3.939 Down Trend,
- (Long-Term) 200 Day: 3.633 Down Trend.
Additional Metrics
Recent Trade Signals
- 31 Jul 2025: Long NG 09-25 @ 3.1 Signals.USAR.TR120
Overall Rating
- Short-Term: Bearish,
- Intermediate-Term: Bearish,
- Long-Term: Bearish.
Key Insights Summary
Natural Gas futures remain in a pronounced downtrend across all timeframes, as confirmed by both swing pivot structure and the alignment of all major moving averages pointing lower. Price action is consolidating near recent lows, with small bars and slow momentum indicating a lack of strong directional conviction after a persistent selloff. The most recent swing pivot is a low at 3.065, with the next potential reversal only above 3.232, suggesting the market is still searching for a bottom. Resistance levels are stacked well above current price, while support is thin, highlighting vulnerability to further downside if selling resumes. The ATR and volume metrics suggest moderate volatility and participation, but not at extremes. The recent long signal may indicate a potential for a short-term bounce or mean reversion, but the broader context remains bearish until a significant pivot high is established and moving averages begin to flatten or turn up. Overall, the market is in a corrective phase, with no clear evidence yet of a sustained reversal.
Chart Analysis ATS AI Generated: 2025-08-03 18:08 for Informational use only, not trading advice. Terms and Risk Disclosure Copyright © 2025. Algo Trading Systems LLC.
