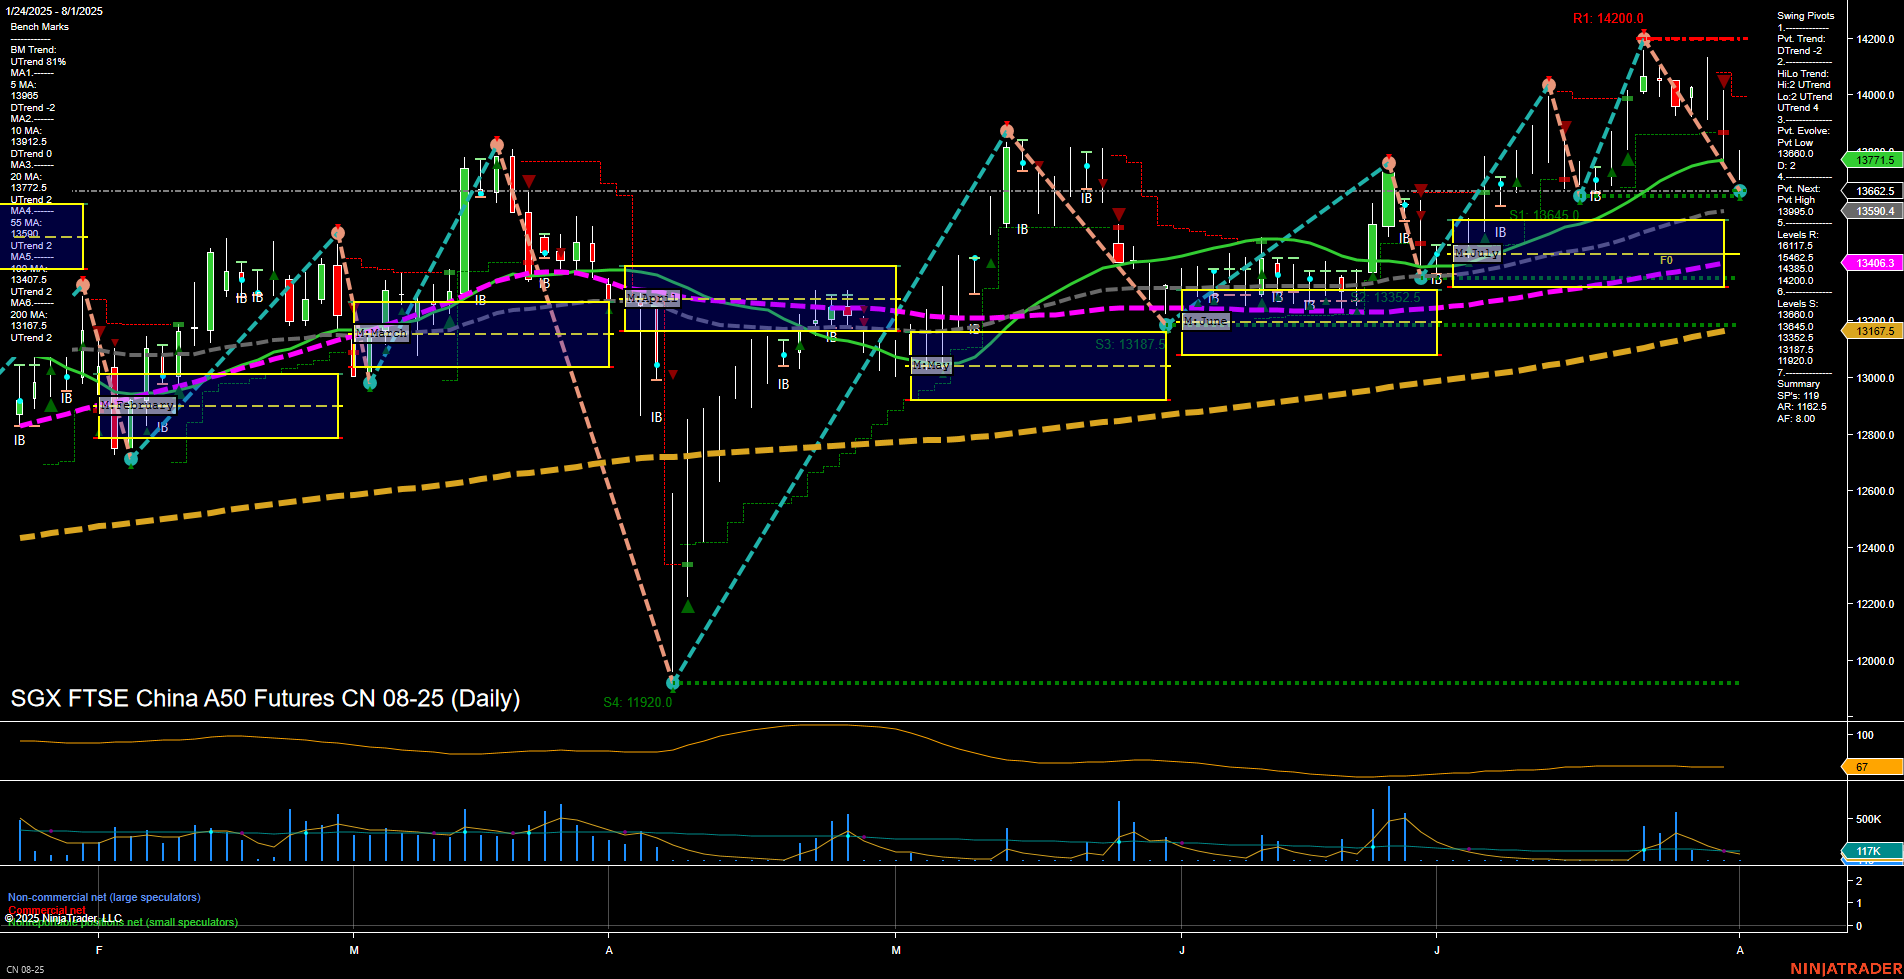
CN SGX FTSE China A50 Futures Daily Chart Analysis: 2025-Aug-03 18:03 CT
Price Action
- Last: 13771.5,
- Bars: Medium,
- Mom: Momentum average.
WSFG Weekly
- Short-Term
- WSFG Current: NA%
- F0%/NTZ' Bias: Price Neutral,
- WSFG Trend: Neutral.
MSFG Month Aug
- Intermediate-Term
- MSFG Current: NA%
- F0%/NTZ' Bias: Price Neutral,
- MSFG Trend: Neutral.
YSFG Year 2025
- Long-Term
- YSFG Current: NA%
- F0%/NTZ' Bias: Price Neutral,
- YSFG Trend: Neutral.
Swing Pivots
- (Short-Term) 1. Pvt. Trend: DTrend,
- (Intermediate-Term) 2. HiLo Trend: UTrend,
- 3. Pvt. Evolve: Pvt Low 13020.0,
- 4. Pvt. Next: Pvt High 13662.5,
- 5. Levels R: 14200.0, 13662.5, 13595.0, 13405.0,
- 6. Levels S: 13167.5, 13020.0, 11920.0.
Daily Benchmarks
- (Short-Term) 5 Day: 13965 Down Trend,
- (Short-Term) 10 Day: 13912.5 Down Trend,
- (Intermediate-Term) 20 Day: 13771.5 Down Trend,
- (Intermediate-Term) 55 Day: 13407.5 Up Trend,
- (Long-Term) 100 Day: 13167.5 Up Trend,
- (Long-Term) 200 Day: 13167.5 Up Trend.
Additional Metrics
- ATR: 87.5,
- VOLMA: 261842.
Overall Rating
- Short-Term: Bearish,
- Intermediate-Term: Neutral,
- Long-Term: Bullish.
Key Insights Summary
The CN SGX FTSE China A50 Futures daily chart shows a market in transition. Short-term momentum has shifted to the downside, as indicated by the DTrend in swing pivots and the downtrend in the 5, 10, and 20-day moving averages. Price is currently below several recent resistance levels, with the next significant support at 13167.5 and 13020.0. Intermediate-term structure remains neutral, with the HiLo trend still in an uptrend and the 55-day moving average trending higher, suggesting underlying support. Long-term outlook is bullish, supported by the 100 and 200-day moving averages both trending up, indicating that the broader trend remains intact despite recent pullbacks. Volatility is moderate, and volume is steady, reflecting a market that is consolidating after a recent swing high. The overall setup suggests a short-term corrective phase within a longer-term uptrend, with key levels to watch for potential reversals or continuation.
Chart Analysis ATS AI Generated: 2025-08-03 18:03 for Informational use only, not trading advice. Terms and Risk Disclosure Copyright © 2025. Algo Trading Systems LLC.
