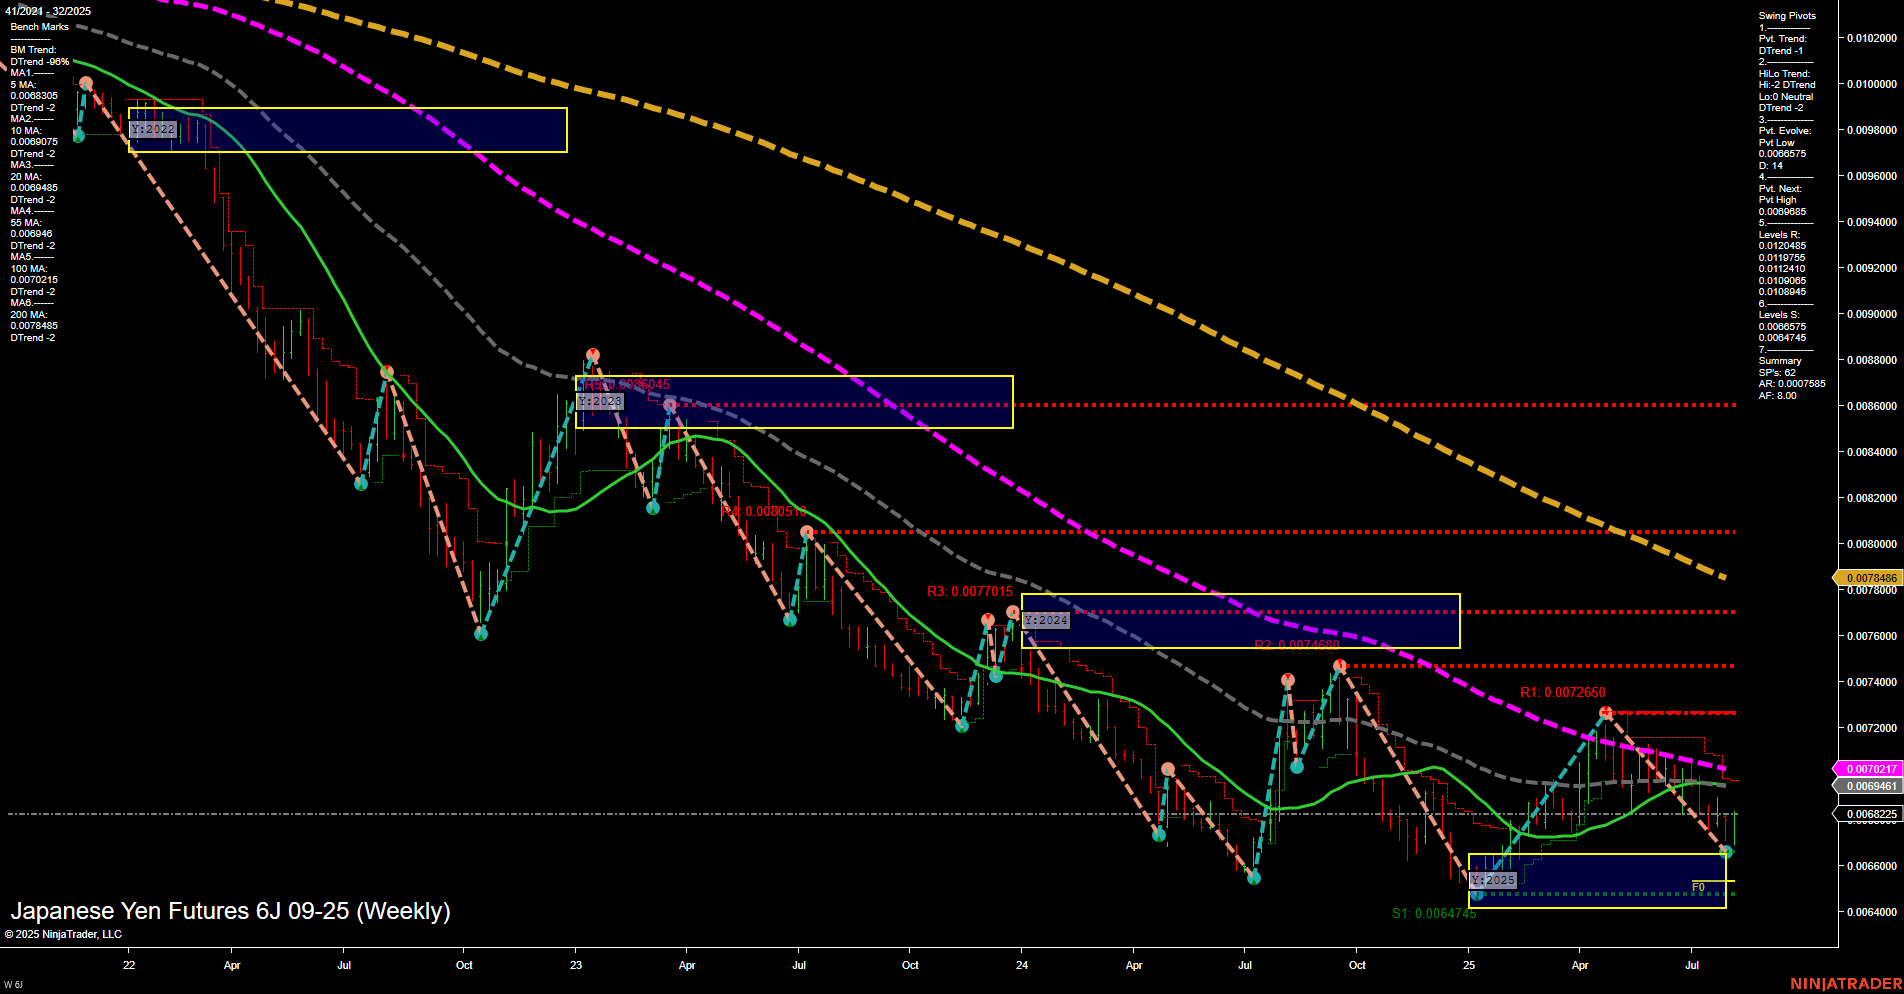
6J Japanese Yen Futures Weekly Chart Analysis: 2025-Aug-03 18:02 CT
Price Action
- Last: 0.00678465,
- Bars: Medium,
- Mom: Momentum slow.
WSFG Weekly
- Short-Term
- WSFG Current: 5%
- F0%/NTZ' Bias: Price Above,
- WSFG Trend: Up.
MSFG Month Aug
- Intermediate-Term
- MSFG Current: 43%
- F0%/NTZ' Bias: Price Above,
- MSFG Trend: Up.
YSFG Year 2025
- Long-Term
- YSFG Current: 25%
- F0%/NTZ' Bias: Price Above,
- YSFG Trend: Up.
Swing Pivots
- (Short-Term) 1. Pvt. Trend: DTrend,
- (Intermediate-Term) 2. HiLo Trend: DTrend,
- 3. Pvt. Evolve: Pvt low 0.0064745,
- 4. Pvt. Next: Pvt high 0.0072017,
- 5. Levels R: 0.008045, 0.008005, 0.0077015, 0.0074600, 0.0072650,
- 6. Levels S: 0.0064745, 0.006225.
Weekly Benchmarks
- (Intermediate-Term) 5 Week: 0.0068305 Down Trend,
- (Intermediate-Term) 10 Week: 0.0068845 Down Trend,
- (Long-Term) 20 Week: 0.0069461 Down Trend,
- (Long-Term) 55 Week: 0.0072017 Down Trend,
- (Long-Term) 100 Week: 0.0077015 Down Trend,
- (Long-Term) 200 Week: 0.008045 Down Trend.
Recent Trade Signals
- 01 Aug 2025: Long 6J 09-25 @ 0.0067865 Signals.USAR.TR120
- 30 Jul 2025: Short 6J 09-25 @ 0.006743 Signals.USAR.TR720
- 28 Jul 2025: Short 6J 09-25 @ 0.006793 Signals.USAR-WSFG
Overall Rating
- Short-Term: Neutral,
- Intermediate-Term: Bearish,
- Long-Term: Bearish.
Key Insights Summary
The 6J Japanese Yen Futures weekly chart shows a market in transition. Price action is currently consolidating near recent lows, with medium-sized bars and slow momentum, indicating a lack of strong directional conviction. The Weekly, Monthly, and Yearly Session Fib Grids all show price above their respective NTZ/F0% levels, suggesting some upward bias in the short to long term. However, both the short-term and intermediate-term swing pivot trends remain in a downtrend, and all major moving averages (from 5-week to 200-week) are trending lower, reinforcing a broader bearish structure. Recent trade signals have been mixed, with both long and short entries triggered in quick succession, reflecting choppy and indecisive price action. Resistance levels are stacked above, while support is anchored at the recent swing low. Overall, the market is showing early signs of potential basing or a pause in the downtrend, but the dominant trend remains bearish on the intermediate and long-term horizons, with only a neutral short-term outlook as the market tests support and attempts to stabilize.
Chart Analysis ATS AI Generated: 2025-08-03 18:02 for Informational use only, not trading advice. Terms and Risk Disclosure Copyright © 2025. Algo Trading Systems LLC.
