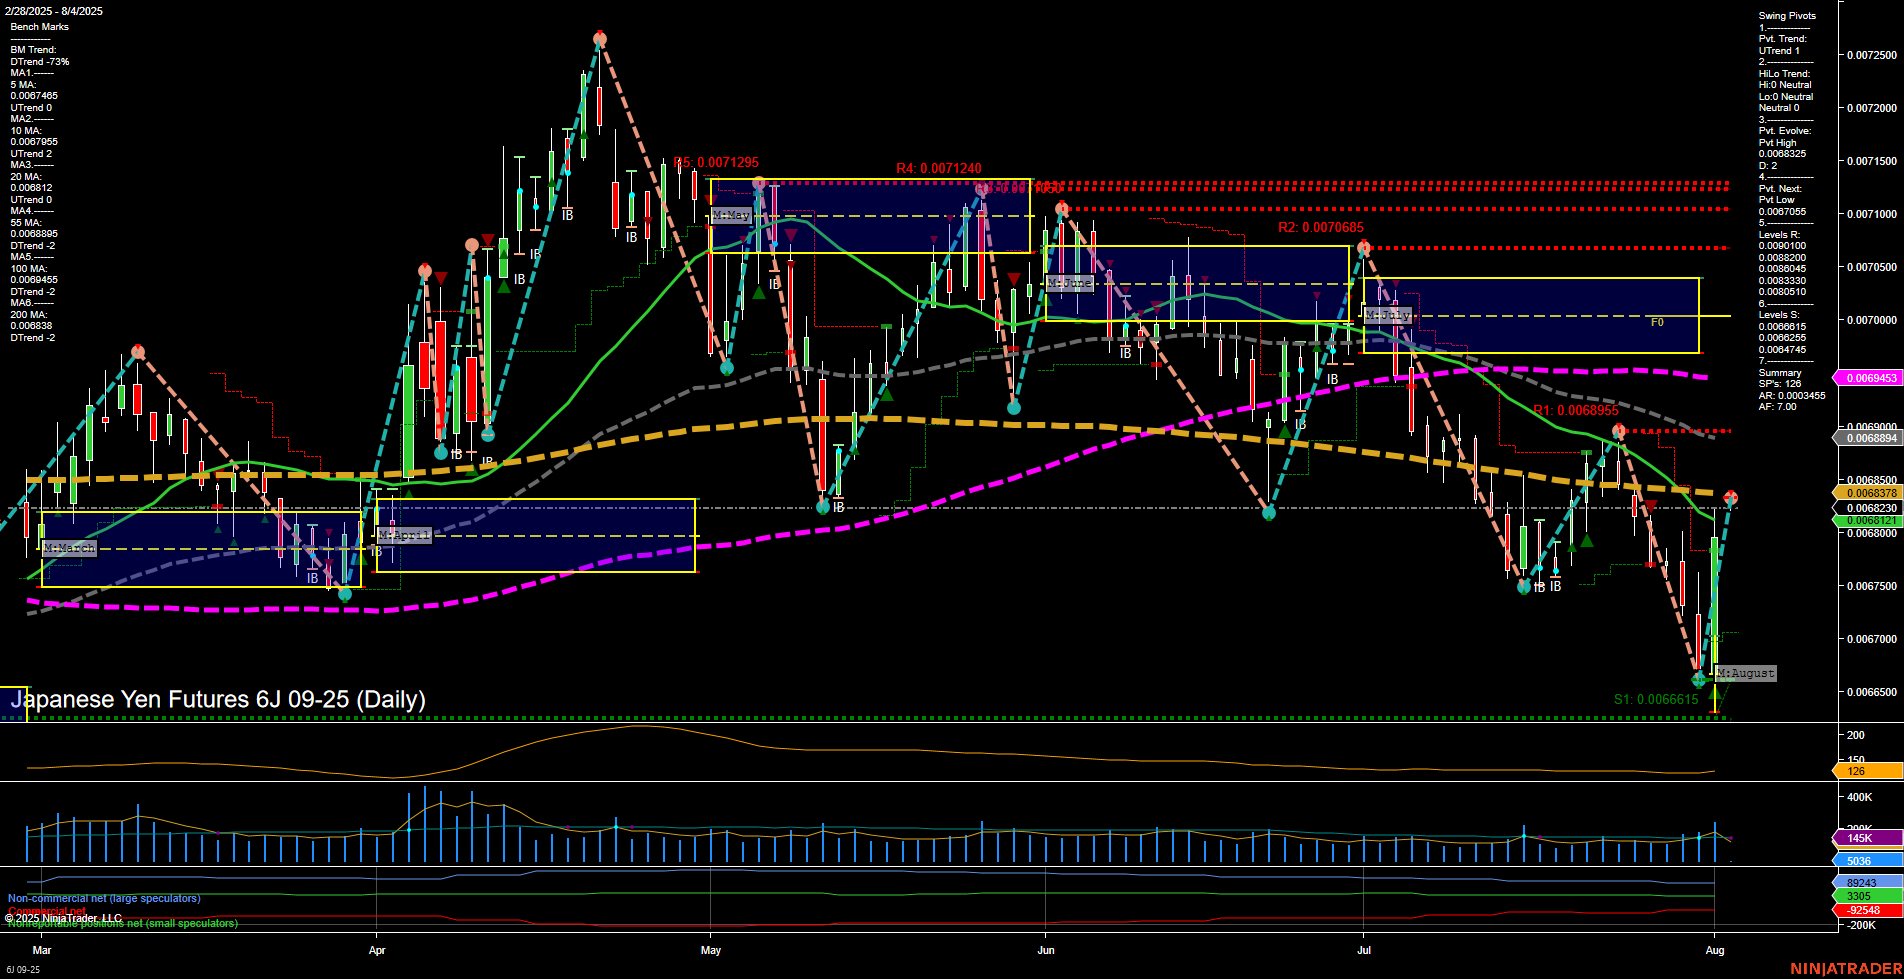
6J Japanese Yen Futures Daily Chart Analysis: 2025-Aug-03 18:01 CT
Price Action
- Last: 0.0068378,
- Bars: Large,
- Mom: Fast.
WSFG Weekly
- Short-Term
- WSFG Current: 5%
- F0%/NTZ' Bias: Price Above,
- WSFG Trend: Up.
MSFG Month Aug
- Intermediate-Term
- MSFG Current: 43%
- F0%/NTZ' Bias: Price Above,
- MSFG Trend: Up.
YSFG Year 2025
- Long-Term
- YSFG Current: 25%
- F0%/NTZ' Bias: Price Above,
- YSFG Trend: Up.
Swing Pivots
- (Short-Term) 1. Pvt. Trend: UTrend,
- (Intermediate-Term) 2. HiLo Trend: Neutral,
- 3. Pvt. Evolve: Pvt High 0.0068230,
- 4. Pvt. Next: Pvt Low 0.0066615,
- 5. Levels R: 0.0070655, 0.0070865, 0.0071240, 0.0071295,
- 6. Levels S: 0.0066615.
Daily Benchmarks
- (Short-Term) 5 Day: 0.0067485 Up Trend,
- (Short-Term) 10 Day: 0.0067955 Up Trend,
- (Intermediate-Term) 20 Day: 0.0068812 Down Trend,
- (Intermediate-Term) 55 Day: 0.0069453 Down Trend,
- (Long-Term) 100 Day: 0.0068845 Down Trend,
- (Long-Term) 200 Day: 0.0069638 Down Trend.
Additional Metrics
Recent Trade Signals
- 01 Aug 2025: Long 6J 09-25 @ 0.0067865 Signals.USAR.TR120
- 30 Jul 2025: Short 6J 09-25 @ 0.006743 Signals.USAR.TR720
- 28 Jul 2025: Short 6J 09-25 @ 0.006793 Signals.USAR-WSFG
Overall Rating
- Short-Term: Bullish,
- Intermediate-Term: Neutral,
- Long-Term: Neutral.
Key Insights Summary
The 6J Japanese Yen Futures daily chart shows a strong short-term recovery with large, fast momentum bars pushing price above key session fib grid levels. The short-term trend has shifted bullish, confirmed by the recent long trade signal and both 5- and 10-day moving averages turning up. However, intermediate and long-term moving averages remain in a downtrend, and the HiLo trend is neutral, indicating that the broader trend context is still consolidative or in transition. Resistance levels are clustered above, suggesting potential headwinds if the rally continues, while support is well-defined at the recent swing low. Volatility is elevated (high ATR), and volume is robust, reflecting increased participation. The overall structure suggests a possible short-term trend continuation or bounce within a larger consolidation, with the market testing whether this move can evolve into a sustained reversal or remains a corrective rally within a longer-term downtrend.
Chart Analysis ATS AI Generated: 2025-08-03 18:02 for Informational use only, not trading advice. Terms and Risk Disclosure Copyright © 2025. Algo Trading Systems LLC.
