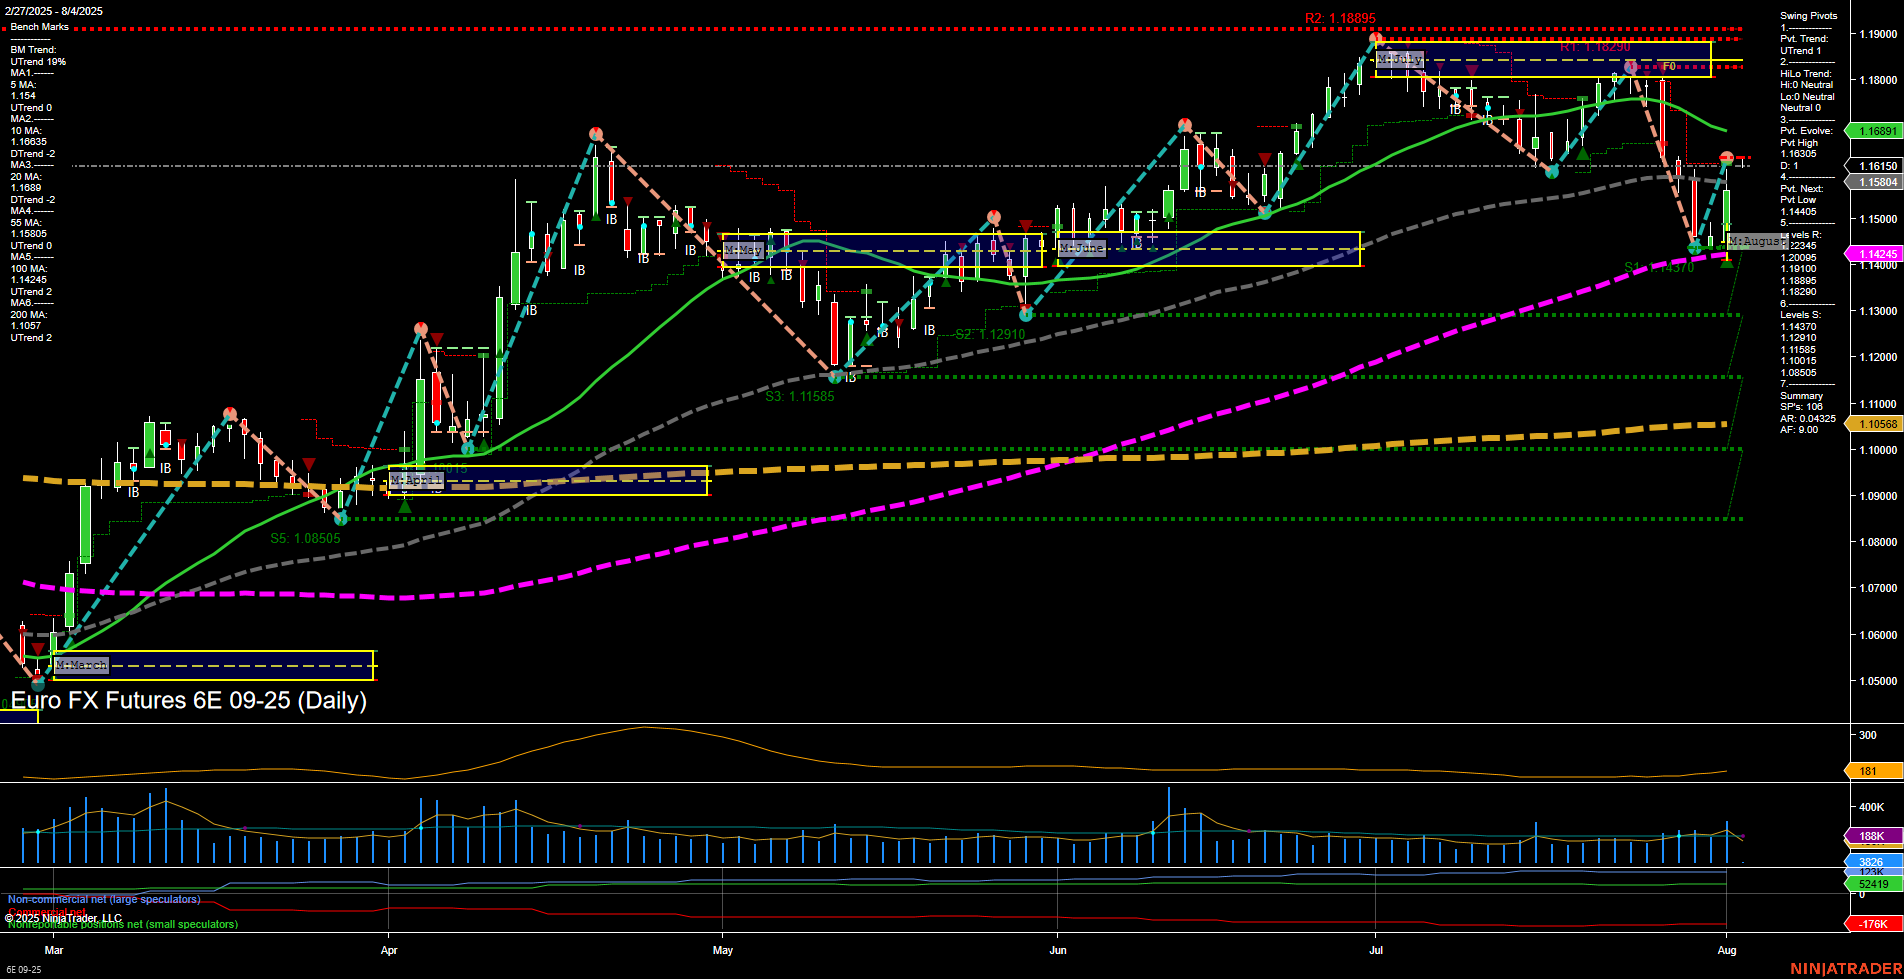
6E Euro FX Futures Daily Chart Analysis: 2025-Aug-03 18:01 CT
Price Action
- Last: 1.14405,
- Bars: Large,
- Mom: Momentum fast.
WSFG Weekly
- Short-Term
- WSFG Current: -2%
- F0%/NTZ' Bias: Price Below,
- WSFG Trend: Down.
MSFG Month Aug
- Intermediate-Term
- MSFG Current: 34%
- F0%/NTZ' Bias: Price Above,
- MSFG Trend: Up.
YSFG Year 2025
- Long-Term
- YSFG Current: 78%
- F0%/NTZ' Bias: Price Above,
- YSFG Trend: Up.
Swing Pivots
- (Short-Term) 1. Pvt. Trend: DTrend,
- (Intermediate-Term) 2. HiLo Trend: UTrend,
- 3. Pvt. Evolve: Pvt high 1.16034,
- 4. Pvt. Next: Pvt low 1.14405,
- 5. Levels R: 1.18895, 1.18501, 1.16891, 1.16034, 1.15540,
- 6. Levels S: 1.14405, 1.12910, 1.11585, 1.10855.
Daily Benchmarks
- (Short-Term) 5 Day: 1.154 Up Trend,
- (Short-Term) 10 Day: 1.1689 Down Trend,
- (Intermediate-Term) 20 Day: 1.1691 Down Trend,
- (Intermediate-Term) 55 Day: 1.1442 Up Trend,
- (Long-Term) 100 Day: 1.1505 Up Trend,
- (Long-Term) 200 Day: 1.1058 Up Trend.
Additional Metrics
Recent Trade Signals
- 01 Aug 2025: Long 6E 09-25 @ 1.1587 Signals.USAR.TR120
- 29 Jul 2025: Short 6E 09-25 @ 1.162 Signals.USAR.TR720
- 28 Jul 2025: Short 6E 09-25 @ 1.17795 Signals.USAR-MSFG
Overall Rating
- Short-Term: Bearish,
- Intermediate-Term: Bullish,
- Long-Term: Bullish.
Key Insights Summary
The 6E Euro FX Futures daily chart shows a recent sharp decline, with price action marked by large, fast-moving bars and momentum to the downside. The short-term trend is bearish, as confirmed by the WSFG and swing pivot trend, with price currently below the weekly NTZ and testing a new swing low at 1.14405. However, intermediate and long-term trends remain bullish, supported by the MSFG and YSFG, with price still above the monthly and yearly NTZs. Moving averages are mixed: short-term MAs are split, with the 5-day up but the 10- and 20-day down, while the 55-, 100-, and 200-day MAs all trend upward, indicating underlying strength. Recent trade signals reflect this volatility, with both long and short entries triggered in the past week. Volatility is elevated (ATR 168), and volume remains robust. The market is currently in a corrective phase within a broader uptrend, with the potential for further downside in the short term before a possible resumption of the larger bullish trend if support levels hold and buyers step in.
Chart Analysis ATS AI Generated: 2025-08-03 18:01 for Informational use only, not trading advice. Terms and Risk Disclosure Copyright © 2025. Algo Trading Systems LLC.
