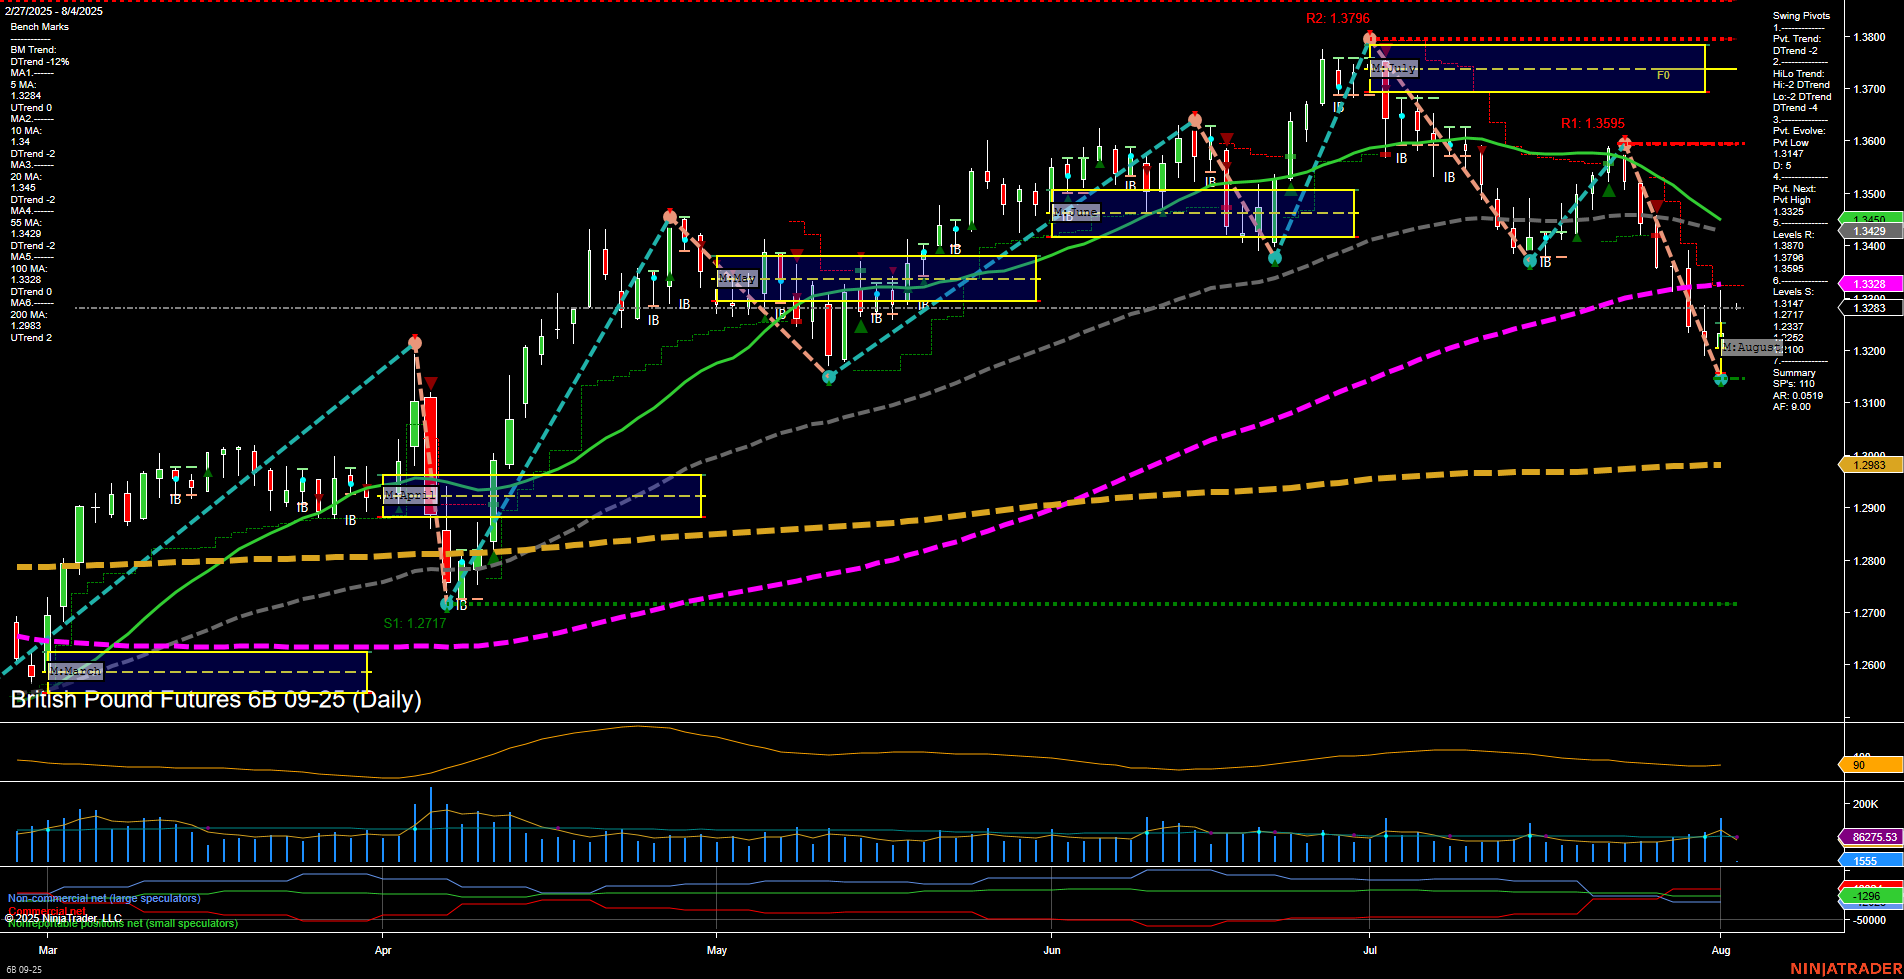
6B British Pound Futures Daily Chart Analysis: 2025-Aug-03 18:00 CT
Price Action
- Last: 1.3325,
- Bars: Large,
- Mom: Momentum fast.
WSFG Weekly
- Short-Term
- WSFG Current: -1%
- F0%/NTZ' Bias: Price Below,
- WSFG Trend: Down.
MSFG Month Aug
- Intermediate-Term
- MSFG Current: 14%
- F0%/NTZ' Bias: Price Above,
- MSFG Trend: Up.
YSFG Year 2025
- Long-Term
- YSFG Current: 39%
- F0%/NTZ' Bias: Price Above,
- YSFG Trend: Up.
Swing Pivots
- (Short-Term) 1. Pvt. Trend: DTrend,
- (Intermediate-Term) 2. HiLo Trend: DTrend,
- 3. Pvt. Evolve: Pvt low 1.3325,
- 4. Pvt. Next: Pvt high 1.3492,
- 5. Levels R: 1.3492, 1.3595, 1.3796,
- 6. Levels S: 1.3283, 1.3177.
Daily Benchmarks
- (Short-Term) 5 Day: 1.3384 Down Trend,
- (Short-Term) 10 Day: 1.3422 Down Trend,
- (Intermediate-Term) 20 Day: 1.3456 Down Trend,
- (Intermediate-Term) 55 Day: 1.3429 Down Trend,
- (Long-Term) 100 Day: 1.3283 Up Trend,
- (Long-Term) 200 Day: 1.2983 Up Trend.
Additional Metrics
Recent Trade Signals
- 01 Aug 2025: Long 6B 09-25 @ 1.3267 Signals.USAR-MSFG
- 01 Aug 2025: Long 6B 09-25 @ 1.3263 Signals.USAR.TR120
- 28 Jul 2025: Short 6B 09-25 @ 1.3415 Signals.USAR-WSFG
Overall Rating
- Short-Term: Bearish,
- Intermediate-Term: Neutral,
- Long-Term: Bullish.
Key Insights Summary
The British Pound Futures (6B) daily chart shows a strong recent selloff, with large bars and fast momentum driving price down to 1.3325. Short-term structure is clearly bearish: price is below the weekly session fib grid (WSFG) NTZ, all short and intermediate-term moving averages are trending down, and the swing pivot trend is in a downtrend with the most recent pivot low just formed. Resistance is stacked above at 1.3492, 1.3595, and 1.3796, while support is close at 1.3283 and 1.3177.
Intermediate and long-term trends remain more constructive, with the monthly and yearly session fib grids still showing price above their NTZs and uptrends, and the 100/200 day MAs in uptrends. Recent trade signals show a mix of short and long entries, reflecting the current transition phase: short-term signals triggered shorts into the recent drop, but new long signals have appeared as price tests support and volatility rises (ATR and VOLMA both elevated).
Overall, the market is in a corrective phase within a longer-term uptrend, with short-term momentum and structure favoring the bears, but intermediate and long-term context still supportive of higher prices if support holds and a reversal develops. The environment is volatile, with potential for sharp countertrend moves as the market tests key support and resistance levels.
Chart Analysis ATS AI Generated: 2025-08-03 18:00 for Informational use only, not trading advice. Terms and Risk Disclosure Copyright © 2025. Algo Trading Systems LLC.
