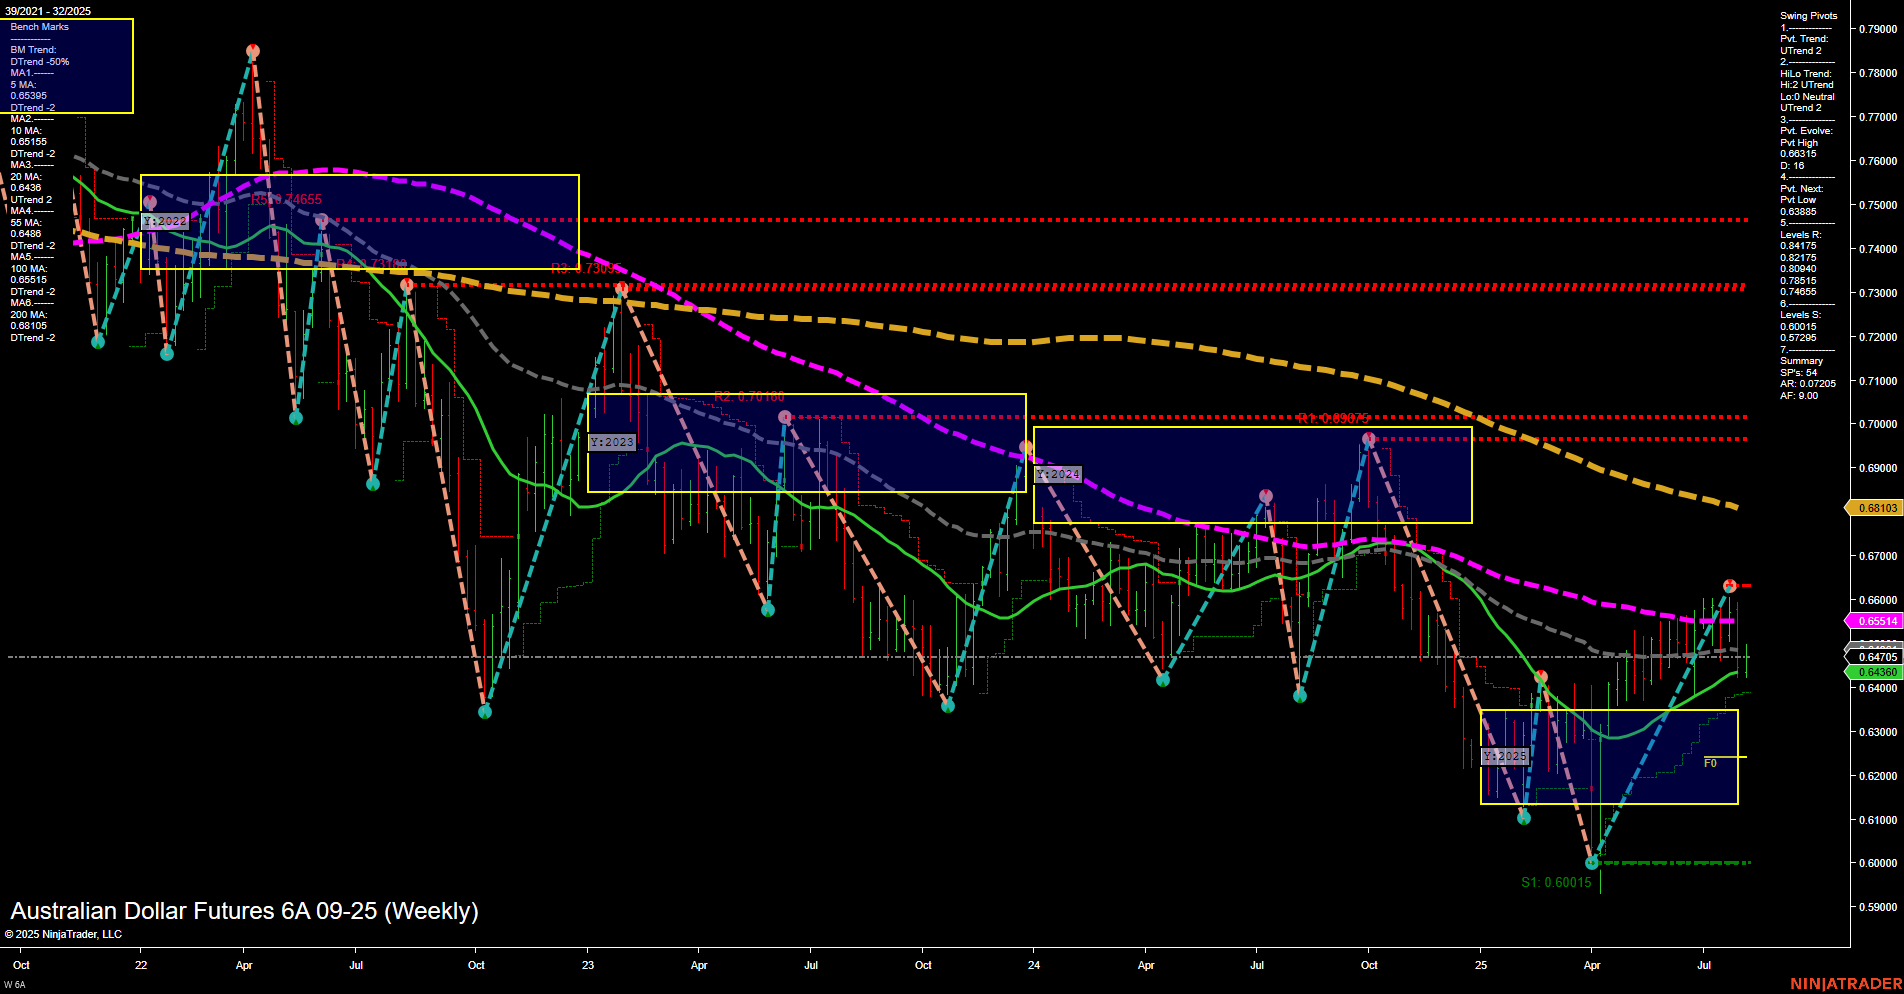
The Australian Dollar Futures (6A) weekly chart shows a recent shift in momentum, with price action moving off the lows and establishing a series of higher lows and higher highs, as indicated by the swing pivot uptrend in both short- and intermediate-term metrics. The last price is testing a recent swing high, and the medium-sized bars with average momentum suggest a steady, controlled advance rather than a sharp breakout. Short- and intermediate-term moving averages (5, 10, and 20 week) are all in uptrends and clustered just below the current price, providing a supportive base. However, the longer-term moving averages (55, 100, and 200 week) remain in downtrends and are positioned well above the current price, highlighting significant overhead resistance and the broader bearish context. The WSFG, MSFG, and YSFG all indicate a neutral bias, with price currently within the NTZ (neutral zone) and not showing a clear breakout from these key Fibonacci grid levels. This suggests the market is in a consolidation phase, potentially building energy for a larger move. Recent trade signals have flipped bullish in the short and intermediate term, with two long entries triggered at the start of August, while a short signal was seen just prior, reflecting the choppy, two-way action typical of a market transitioning from a downtrend to a possible base or early uptrend. Key resistance levels to watch are 0.64765 (current swing high), 0.65511 (55-week MA), and 0.68103 (100-week MA). Support is found at 0.63885, 0.63450, and the major swing low at 0.60015. The overall structure suggests a market in recovery mode, with short- and intermediate-term bullishness facing a test against entrenched long-term resistance. The price action is consistent with a potential bottoming process, but confirmation of a sustained trend change will require a decisive move above the 55- and 100-week moving averages.