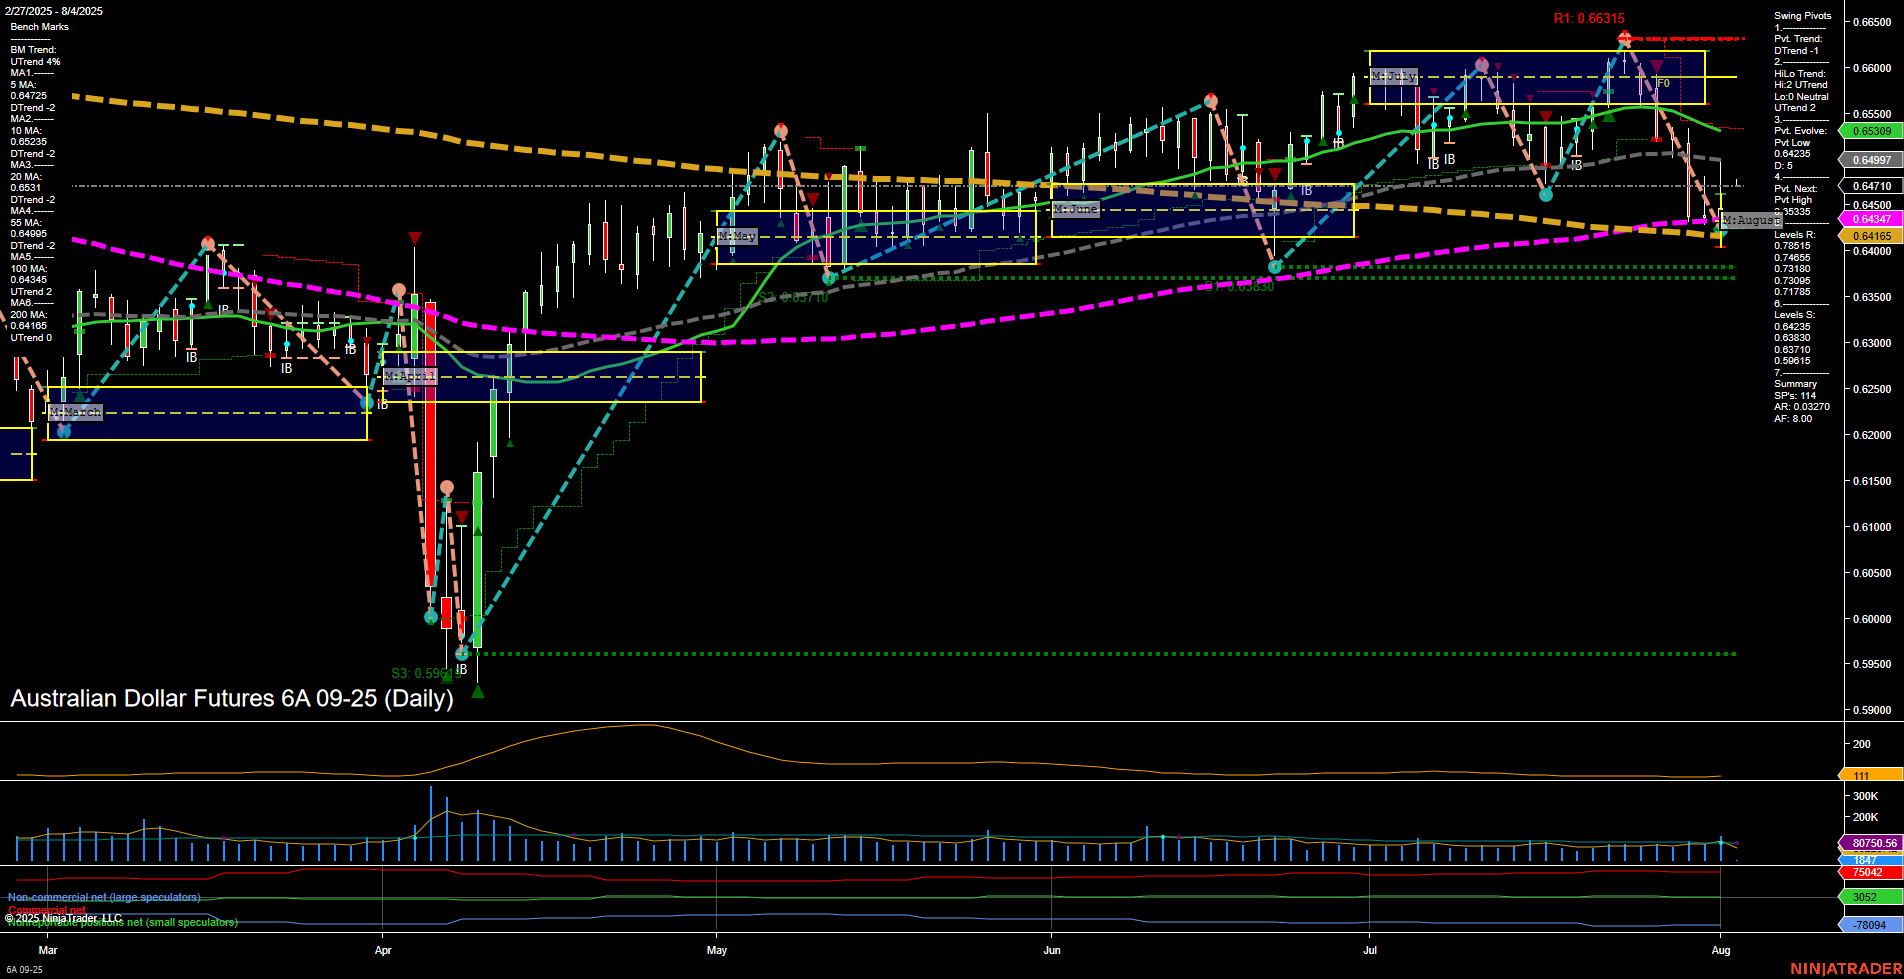
6A Australian Dollar Futures Daily Chart Analysis: 2025-Aug-03 18:00 CT
Price Action
- Last: 0.64719,
- Bars: Medium,
- Mom: Momentum slow.
WSFG Weekly
- Short-Term
- WSFG Current: NA%
- F0%/NTZ' Bias: Price Neutral,
- WSFG Trend: Neutral.
MSFG Month Aug
- Intermediate-Term
- MSFG Current: NA%
- F0%/NTZ' Bias: Price Neutral,
- MSFG Trend: Neutral.
YSFG Year 2025
- Long-Term
- YSFG Current: NA%
- F0%/NTZ' Bias: Price Neutral,
- YSFG Trend: Neutral.
Swing Pivots
- (Short-Term) 1. Pvt. Trend: DTrend,
- (Intermediate-Term) 2. HiLo Trend: UTrend,
- 3. Pvt. Evolve: Pvt Low 0.64245,
- 4. Pvt. Next: Pvt High 0.65425,
- 5. Levels R: 0.66315, 0.65425, 0.64719,
- 6. Levels S: 0.64245, 0.64165, 0.63910, 0.63830, 0.63170, 0.59915.
Daily Benchmarks
- (Short-Term) 5 Day: 0.64725 Down Trend,
- (Short-Term) 10 Day: 0.64565 Down Trend,
- (Intermediate-Term) 20 Day: 0.65399 Down Trend,
- (Intermediate-Term) 55 Day: 0.65400 Down Trend,
- (Long-Term) 100 Day: 0.64165 Up Trend,
- (Long-Term) 200 Day: 0.64500 Down Trend.
Additional Metrics
Recent Trade Signals
- 01 Aug 2025: Long 6A 09-25 @ 0.64715 Signals.USAR.TR120
- 01 Aug 2025: Long 6A 09-25 @ 0.64725 Signals.USAR-MSFG
- 30 Jul 2025: Short 6A 09-25 @ 0.64565 Signals.USAR.TR720
Overall Rating
- Short-Term: Bearish,
- Intermediate-Term: Neutral,
- Long-Term: Neutral.
Key Insights Summary
The 6A Australian Dollar Futures daily chart shows a market in transition, with short-term momentum turning bearish as indicated by the DTrend in swing pivots and downtrends across the 5, 10, 20, 55, and 200-day moving averages. The intermediate-term HiLo Trend remains in an uptrend, suggesting underlying support, but the price is currently testing lower support levels near 0.64245. The long-term trend is neutral, with the 100-day MA still in an uptrend but other long-term benchmarks pointing down. Recent trade signals reflect mixed sentiment, with both long and short entries triggered in the past week, highlighting choppy and indecisive price action. Volatility is moderate, and volume remains steady. The market appears to be consolidating after a failed attempt to break higher, with resistance at 0.66315 and multiple support levels below. This environment suggests a period of sideways movement or potential for further downside if support fails, while the broader trend context remains mixed.
Chart Analysis ATS AI Generated: 2025-08-03 18:00 for Informational use only, not trading advice. Terms and Risk Disclosure Copyright © 2025. Algo Trading Systems LLC.
