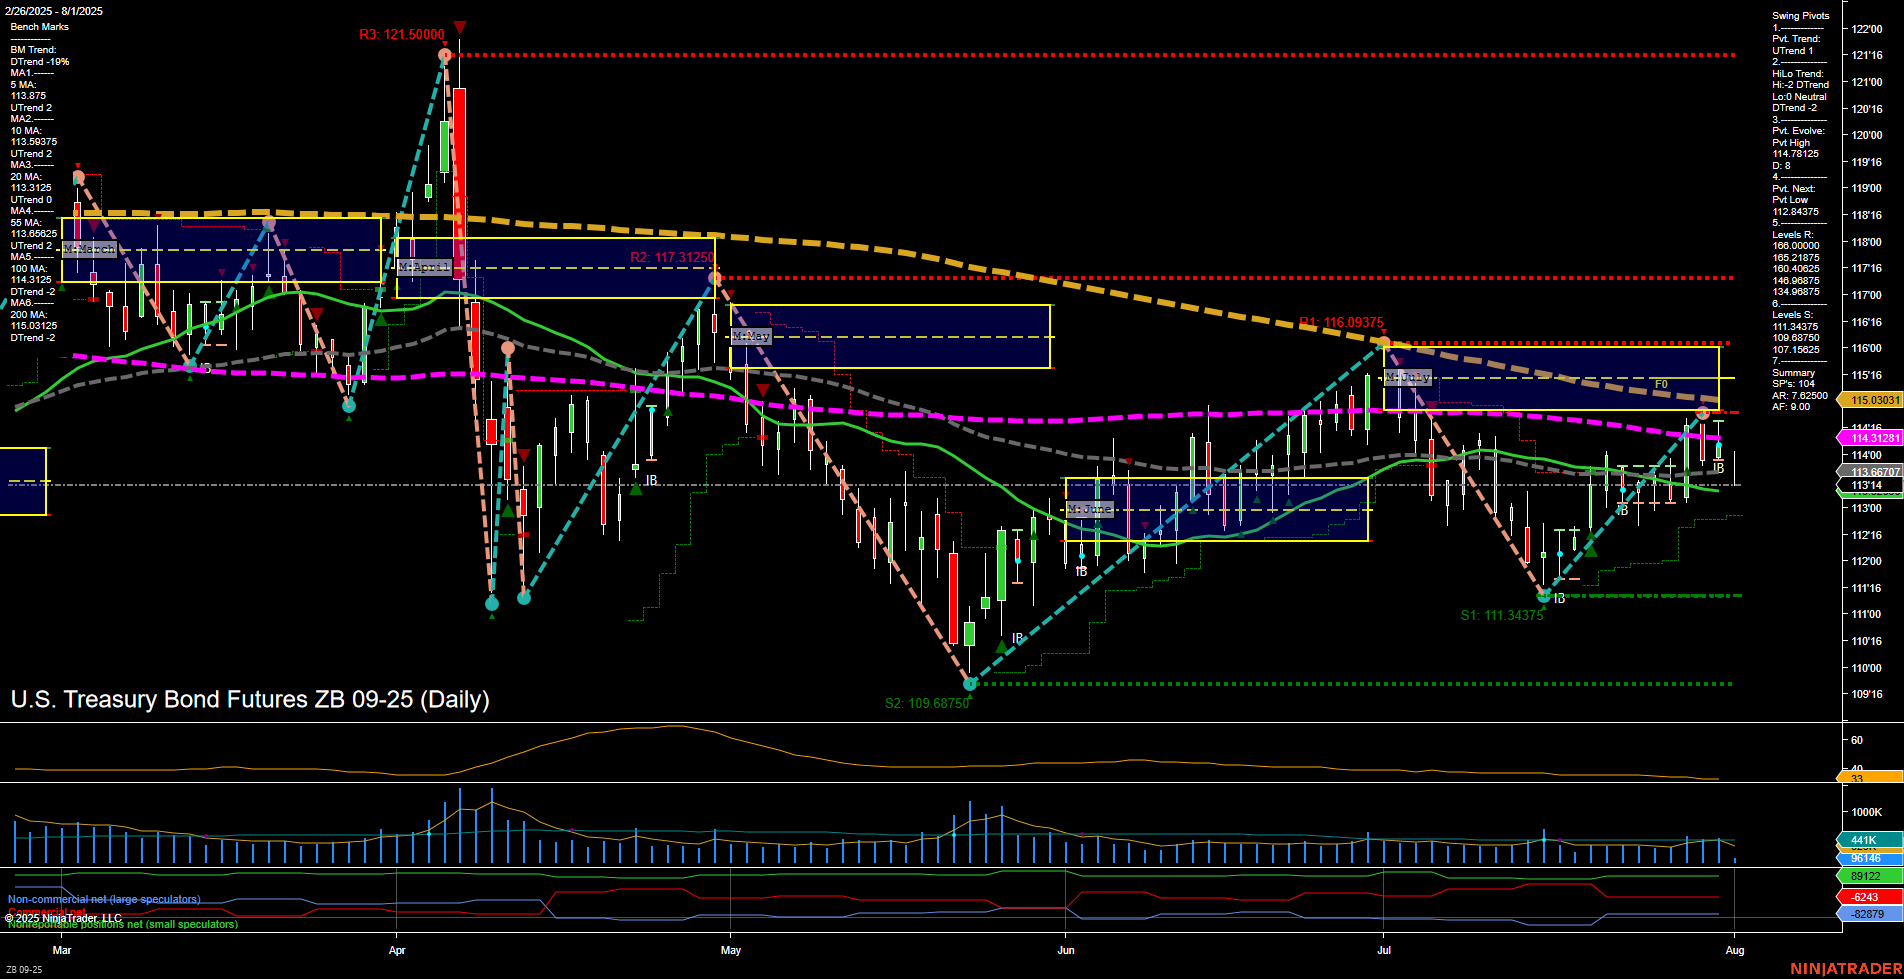
ZB U.S. Treasury Bond Futures Daily Chart Analysis: 2025-Aug-01 07:19 CT
Price Action
- Last: 114'31,
- Bars: Medium,
- Mom: Momentum average.
WSFG Weekly
- Short-Term
- WSFG Current: NA%
- F0%/NTZ' Bias: Price Neutral,
- WSFG Trend: Neutral.
MSFG Month Aug
- Intermediate-Term
- MSFG Current: NA%
- F0%/NTZ' Bias: Price Neutral,
- MSFG Trend: Neutral.
YSFG Year 2025
- Long-Term
- YSFG Current: NA%
- F0%/NTZ' Bias: Price Neutral,
- YSFG Trend: Neutral.
Swing Pivots
- (Short-Term) 1. Pvt. Trend: UTrend,
- (Intermediate-Term) 2. HiLo Trend: DTrend,
- 3. Pvt. Evolve: Pvt high 114.875,
- 4. Pvt. Next: Pvt low 112.84375,
- 5. Levels R: 121.500, 117.3125, 116.09375, 114.875,
- 6. Levels S: 111.34375, 109.6875.
Daily Benchmarks
- (Short-Term) 5 Day: 113.875 Up Trend,
- (Short-Term) 10 Day: 113.6875 Up Trend,
- (Intermediate-Term) 20 Day: 114.31281 Up Trend,
- (Intermediate-Term) 55 Day: 113.115 Down Trend,
- (Long-Term) 100 Day: 113.8625 Down Trend,
- (Long-Term) 200 Day: 115.0331 Down Trend.
Additional Metrics
Overall Rating
- Short-Term: Bullish,
- Intermediate-Term: Neutral,
- Long-Term: Bearish.
Key Insights Summary
The ZB U.S. Treasury Bond Futures daily chart currently reflects a mixed environment. Short-term momentum is positive, with price above the 5, 10, and 20-day moving averages, and the swing pivot trend is up. However, intermediate and long-term trends remain less supportive, as the 55, 100, and 200-day moving averages are still in downtrends, and the HiLo swing trend is down. Price is consolidating near the upper end of the recent range, just below a key resistance pivot at 114.875, with significant resistance levels overhead and support at 111.34375 and 109.6875. Volatility is moderate, and volume is steady. The overall structure suggests a short-term bullish bias within a broader neutral-to-bearish context, with the market potentially in a retracement or consolidation phase after a prior downtrend. No clear breakout or breakdown is evident, and the market appears to be testing resistance while holding above recent swing lows.
Chart Analysis ATS AI Generated: 2025-08-01 07:20 for Informational use only, not trading advice. Terms and Risk Disclosure Copyright © 2025. Algo Trading Systems LLC.
