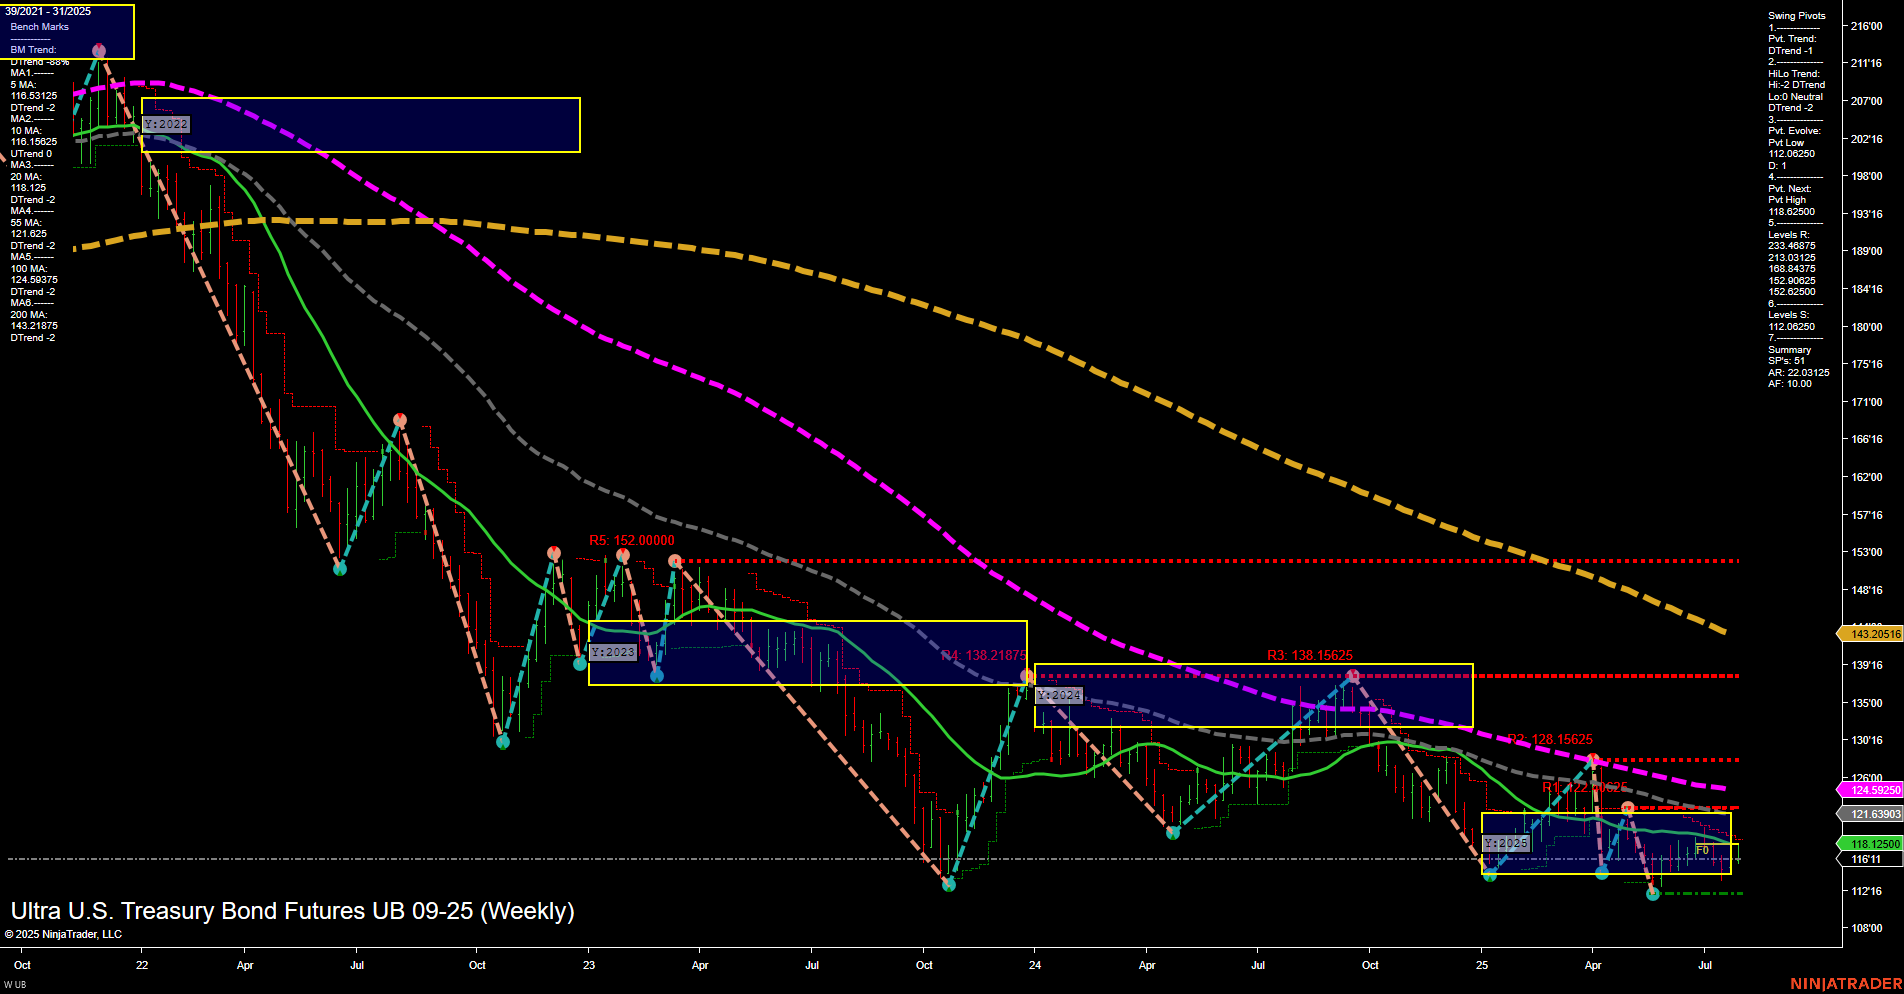
UB Ultra U.S. Treasury Bond Futures Weekly Chart Analysis: 2025-Aug-01 07:18 CT
Price Action
- Last: 118.21875,
- Bars: Medium,
- Mom: Momentum slow.
WSFG Weekly
- Short-Term
- WSFG Current: 23%
- F0%/NTZ' Bias: Price Above,
- WSFG Trend: Up.
MSFG Month Aug
- Intermediate-Term
- MSFG Current: -4%
- F0%/NTZ' Bias: Price Below,
- MSFG Trend: Down.
YSFG Year 2025
- Long-Term
- YSFG Current: -4%
- F0%/NTZ' Bias: Price Below,
- YSFG Trend: Down.
Swing Pivots
- (Short-Term) 1. Pvt. Trend: DTrend,
- (Intermediate-Term) 2. HiLo Trend: DTrend,
- 3. Pvt. Evolve: Pvt low 112.06250,
- 4. Pvt. Next: Pvt high 118.828125,
- 5. Levels R: 233.40625, 213.84375, 184.03125, 152.00000, 138.21875, 128.15625, 122.90625, 118.828125,
- 6. Levels S: 112.06250.
Weekly Benchmarks
- (Intermediate-Term) 5 Week: 116.593125 Down Trend,
- (Intermediate-Term) 10 Week: 116.9625 Down Trend,
- (Long-Term) 20 Week: 118.21875 Down Trend,
- (Long-Term) 55 Week: 124.59250 Down Trend,
- (Long-Term) 100 Week: 143.20516 Down Trend,
- (Long-Term) 200 Week: 171.69303 Down Trend.
Recent Trade Signals
- 30 Jul 2025: Long UB 09-25 @ 117.71875 Signals.USAR.TR720
- 29 Jul 2025: Long UB 09-25 @ 116.4375 Signals.USAR-WSFG
- 28 Jul 2025: Long UB 09-25 @ 116.59375 Signals.USAR.TR120
Overall Rating
- Short-Term: Neutral,
- Intermediate-Term: Bearish,
- Long-Term: Bearish.
Key Insights Summary
The UB Ultra U.S. Treasury Bond Futures weekly chart shows a market in a prolonged downtrend, with all major long-term moving averages (20, 55, 100, 200 week) trending lower and price trading below these key benchmarks. The short-term WSFG trend has turned up, with price currently above the weekly NTZ center, suggesting a potential for a short-term bounce or consolidation phase. However, both the intermediate and long-term session fib grid trends remain down, and swing pivot analysis confirms a dominant downtrend with the most recent pivot low at 112.06250 and resistance levels stacked above current price. Recent trade signals indicate some short-term buying interest, but the overall structure remains heavy, with rallies likely to encounter resistance at prior swing highs and major moving averages. The market appears to be in a corrective phase within a broader bearish cycle, with volatility compressing and momentum slow, hinting at possible range-bound action or a base-building attempt before any sustained reversal.
Chart Analysis ATS AI Generated: 2025-08-01 07:18 for Informational use only, not trading advice. Terms and Risk Disclosure Copyright © 2025. Algo Trading Systems LLC.
