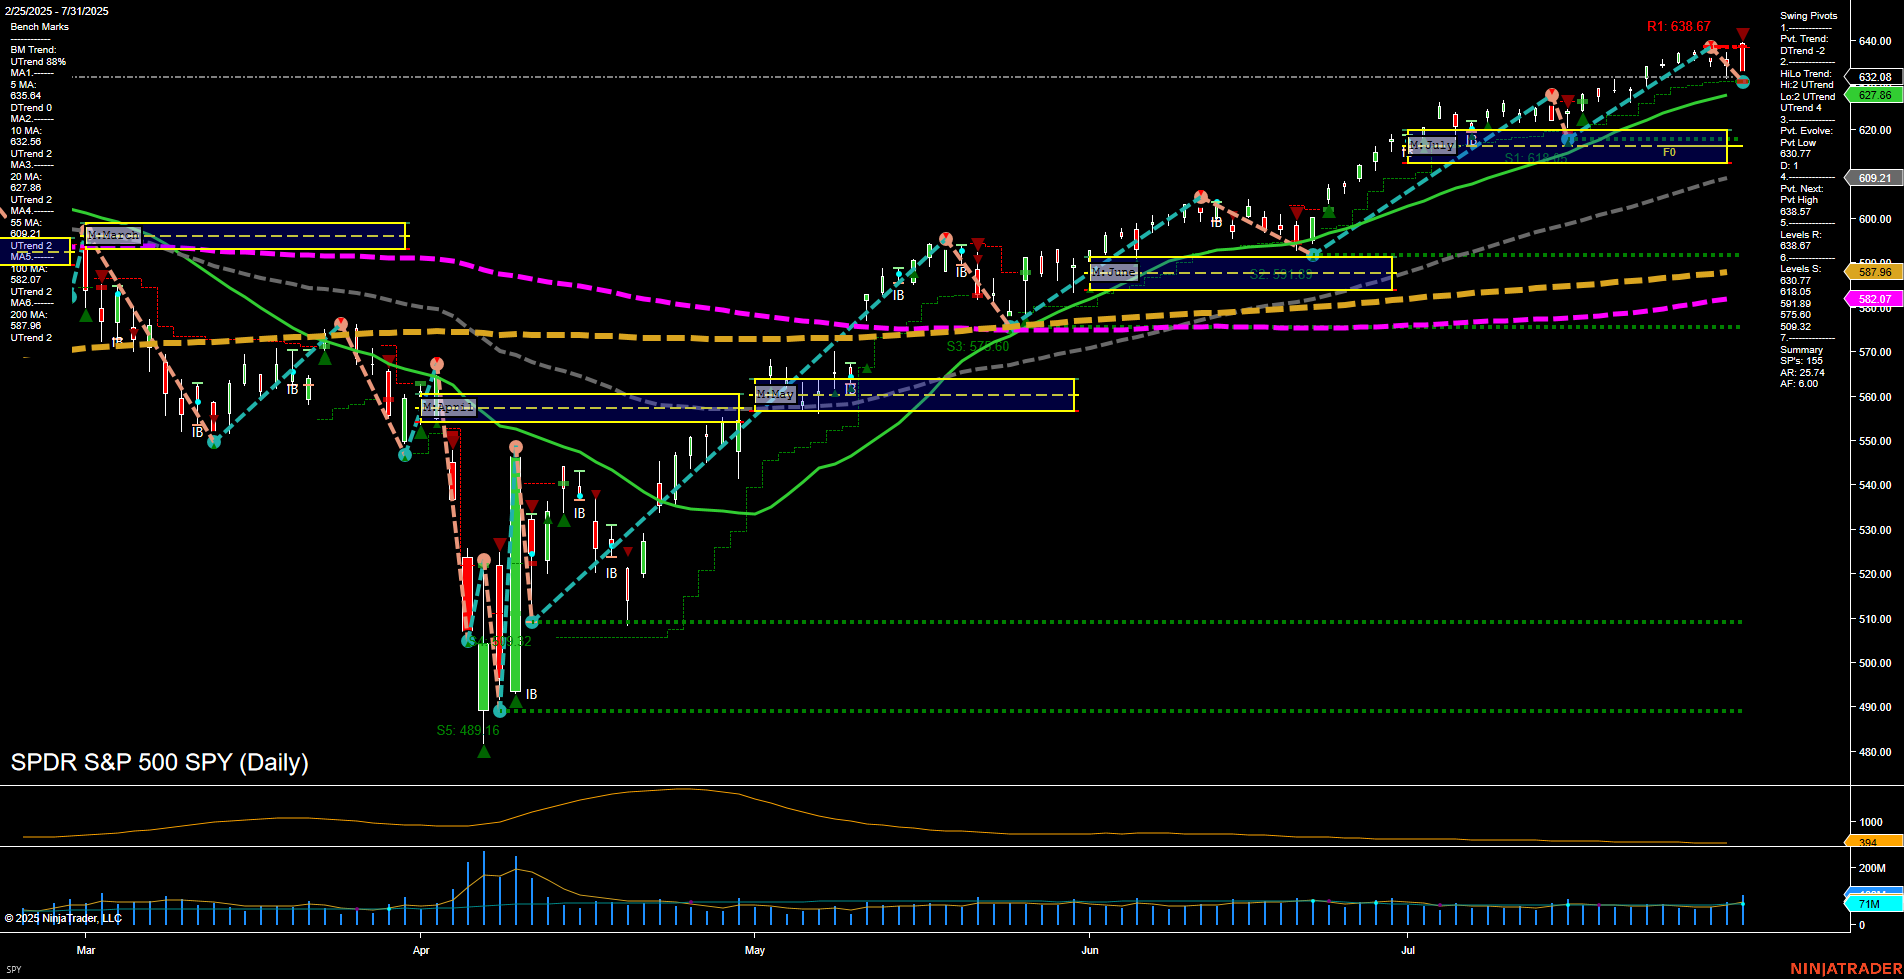
SPY SPDR S&P 500 Daily Chart Analysis: 2025-Aug-01 07:17 CT
Price Action
- Last: 632.86,
- Bars: Medium,
- Mom: Average.
WSFG Weekly
- Short-Term
- WSFG Current: NA%
- F0%/NTZ' Bias: Price Neutral,
- WSFG Trend: Neutral.
MSFG Month Aug
- Intermediate-Term
- MSFG Current: NA%
- F0%/NTZ' Bias: Price Neutral,
- MSFG Trend: Neutral.
YSFG Year 2025
- Long-Term
- YSFG Current: NA%
- F0%/NTZ' Bias: Price Neutral,
- YSFG Trend: Neutral.
Swing Pivots
- (Short-Term) 1. Pvt. Trend: DTrend,
- (Intermediate-Term) 2. HiLo Trend: UTrend,
- 3. Pvt. Evolve: Pvt high 638.67,
- 4. Pvt. Next: Pvt low 627.86,
- 5. Levels R: 638.67, 632.08,
- 6. Levels S: 627.86, 609.21, 587.96, 532.07.
Daily Benchmarks
- (Short-Term) 5 Day: 635.04 Up Trend,
- (Short-Term) 10 Day: 632.56 Up Trend,
- (Intermediate-Term) 20 Day: 627.86 Up Trend,
- (Intermediate-Term) 55 Day: 609.21 Up Trend,
- (Long-Term) 100 Day: 587.96 Up Trend,
- (Long-Term) 200 Day: 532.07 Up Trend.
Additional Metrics
- ATR: 564,
- VOLMA: 47470907.
Overall Rating
- Short-Term: Neutral,
- Intermediate-Term: Bullish,
- Long-Term: Bullish.
Key Insights Summary
The SPY daily chart shows a market that has recently shifted to a short-term downtrend (DTrend) after printing a new swing high at 638.67, with the next key pivot low at 627.86. Despite this short-term reversal, the intermediate and long-term trends remain firmly bullish, as confirmed by all major moving averages trending upward and price holding well above key support levels. The market is consolidating near all-time highs, with volatility (ATR) and volume (VOLMA) at moderate levels, suggesting a pause or digestion phase after a strong rally. The presence of multiple support levels below current price, and the lack of significant resistance above the recent high, indicate that the broader uptrend remains intact. Futures swing traders may interpret this as a market in a healthy pullback or consolidation within a larger bullish structure, with no immediate signs of major reversal. The technical environment is characterized by higher lows, trend continuation patterns, and a lack of aggressive selling pressure, supporting a constructive outlook for the intermediate and long-term timeframes.
Chart Analysis ATS AI Generated: 2025-08-01 07:17 for Informational use only, not trading advice. Terms and Risk Disclosure Copyright © 2025. Algo Trading Systems LLC.
