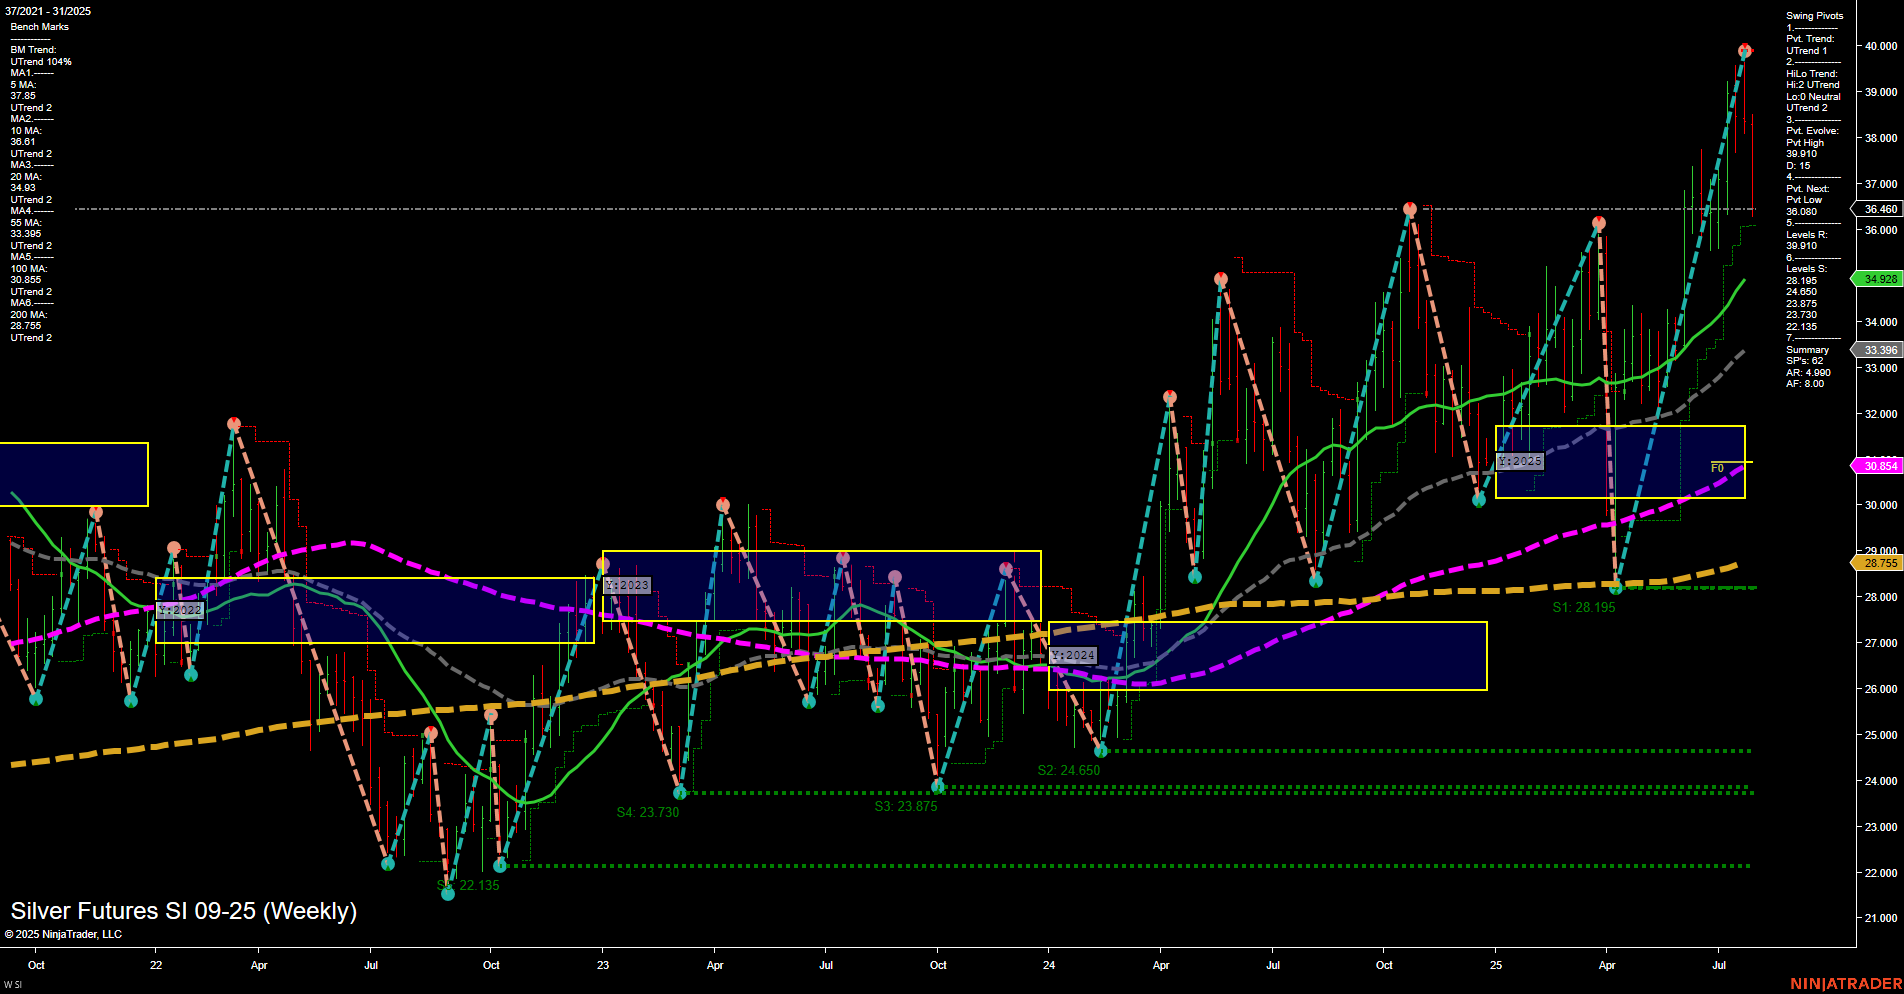
SI Silver Futures Weekly Chart Analysis: 2025-Aug-01 07:16 CT
Price Action
- Last: 39.019,
- Bars: Large,
- Mom: Momentum fast.
WSFG Weekly
- Short-Term
- WSFG Current: -91%
- F0%/NTZ' Bias: Price Below,
- WSFG Trend: Down.
MSFG Month Aug
- Intermediate-Term
- MSFG Current: -4%
- F0%/NTZ' Bias: Price Below,
- MSFG Trend: Down.
YSFG Year 2025
- Long-Term
- YSFG Current: 70%
- F0%/NTZ' Bias: Price Above,
- YSFG Trend: Up.
Swing Pivots
- (Short-Term) 1. Pvt. Trend: UTrend,
- (Intermediate-Term) 2. HiLo Trend: UTrend,
- 3. Pvt. Evolve: Pvt high 39.019,
- 4. Pvt. Next: Pvt low 36.469,
- 5. Levels R: 39.019, 38.000, 36.469,
- 6. Levels S: 34.928, 33.396, 30.854, 28.195, 24.650, 23.875, 23.730, 22.135.
Weekly Benchmarks
- (Intermediate-Term) 5 Week: 37.385 Up Trend,
- (Intermediate-Term) 10 Week: 36.981 Up Trend,
- (Long-Term) 20 Week: 34.928 Up Trend,
- (Long-Term) 55 Week: 33.396 Up Trend,
- (Long-Term) 100 Week: 30.854 Up Trend,
- (Long-Term) 200 Week: 28.755 Up Trend.
Recent Trade Signals
- 30 Jul 2025: Short SI 09-25 @ 37.695 Signals.USAR.TR720
- 30 Jul 2025: Short SI 09-25 @ 37.89 Signals.USAR-WSFG
- 25 Jul 2025: Short SI 09-25 @ 39.03 Signals.USAR.TR120
Overall Rating
- Short-Term: Bearish,
- Intermediate-Term: Bearish,
- Long-Term: Bullish.
Key Insights Summary
Silver futures have recently experienced a strong upward move, as indicated by large bars and fast momentum, pushing price to new swing highs at 39.019. Despite this, both the weekly and monthly session fib grids (WSFG and MSFG) show price below their respective NTZ/F0% levels, with trends pointing down, suggesting short- and intermediate-term weakness or a potential retracement phase. However, the yearly session fib grid (YSFG) remains firmly bullish, with price well above the yearly NTZ/F0% and a strong uptrend across all long-term moving averages. Swing pivots confirm the current uptrend, but the next key pivot low at 36.469 and a cluster of support levels below highlight areas to watch for potential pullbacks. Recent trade signals have triggered short entries, reflecting the short-term bearish bias despite the broader uptrend. Overall, the market is in a corrective phase within a larger bullish structure, with volatility elevated and the potential for further retracement before the long-term uptrend resumes.
Chart Analysis ATS AI Generated: 2025-08-01 07:16 for Informational use only, not trading advice. Terms and Risk Disclosure Copyright © 2025. Algo Trading Systems LLC.
