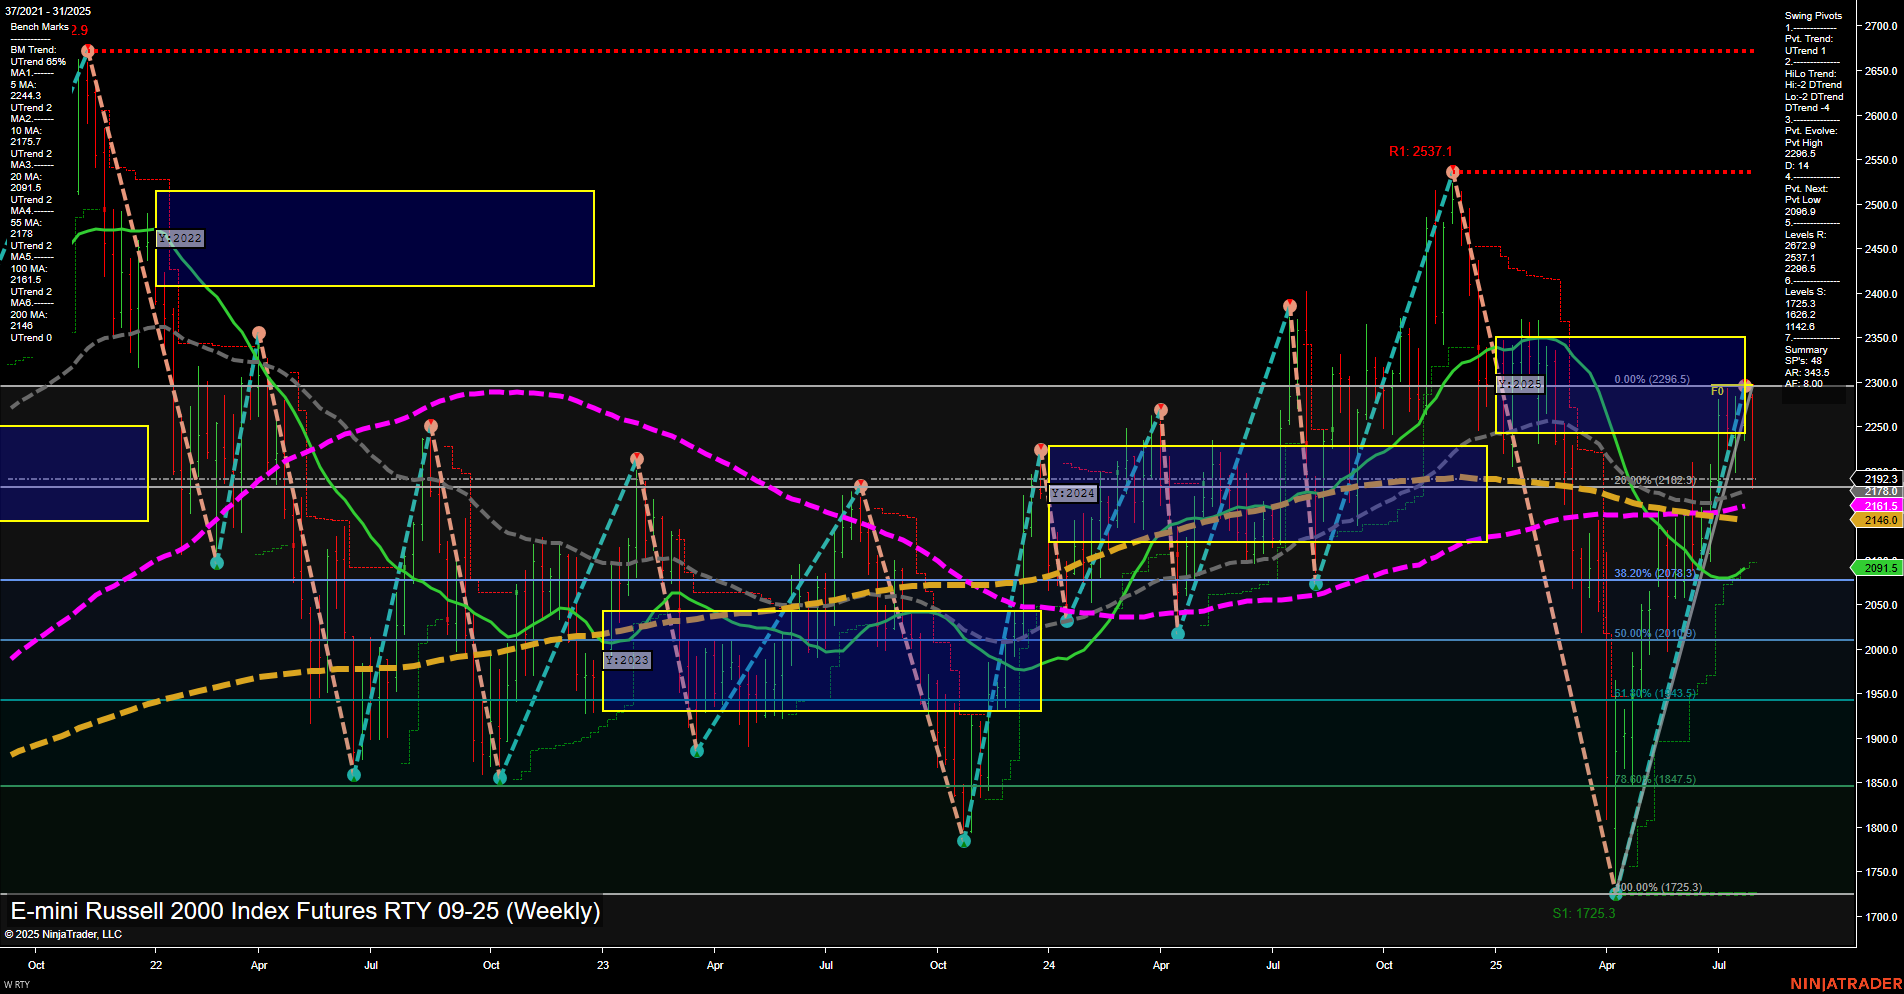
RTY E-mini Russell 2000 Index Futures Weekly Chart Analysis: 2025-Aug-01 07:15 CT
Price Action
- Last: 2193.2,
- Bars: Medium,
- Mom: Momentum slow.
WSFG Weekly
- Short-Term
- WSFG Current: -125%
- F0%/NTZ' Bias: Price Below,
- WSFG Trend: Down.
MSFG Month Aug
- Intermediate-Term
- MSFG Current: -15%
- F0%/NTZ' Bias: Price Below,
- MSFG Trend: Down.
YSFG Year 2025
- Long-Term
- YSFG Current: -20%
- F0%/NTZ' Bias: Price Below,
- YSFG Trend: Down.
Swing Pivots
- (Short-Term) 1. Pvt. Trend: DTrend,
- (Intermediate-Term) 2. HiLo Trend: DTrend,
- 3. Pvt. Evolve: Pvt high 2249.6,
- 4. Pvt. Next: Pvt low 2069.5,
- 5. Levels R: 2537.1, 2249.6, 2225.7, 2178.5,
- 6. Levels S: 2069.5, 1725.3.
Weekly Benchmarks
- (Intermediate-Term) 5 Week: 2244.3 Down Trend,
- (Intermediate-Term) 10 Week: 2179.7 Down Trend,
- (Long-Term) 20 Week: 2161.5 Up Trend,
- (Long-Term) 55 Week: 2091.5 Up Trend,
- (Long-Term) 100 Week: 2146.6 Down Trend,
- (Long-Term) 200 Week: 2160.0 Down Trend.
Recent Trade Signals
- 01 Aug 2025: Short RTY 09-25 @ 2194.4 Signals.USAR-MSFG
- 30 Jul 2025: Short RTY 09-25 @ 2263.8 Signals.USAR-WSFG
- 28 Jul 2025: Short RTY 09-25 @ 2264.6 Signals.USAR.TR120
Overall Rating
- Short-Term: Bearish,
- Intermediate-Term: Bearish,
- Long-Term: Bearish.
Key Insights Summary
The RTY E-mini Russell 2000 Index Futures weekly chart is showing a clear bearish structure across all timeframes. Price is currently below all major session Fib grid centers (WSFG, MSFG, YSFG), with the most recent momentum being slow and bars of medium size, indicating a lack of strong buying interest. The swing pivot summary confirms a dominant downtrend in both short- and intermediate-term trends, with the next significant support at 2069.5 and major resistance levels overhead at 2249.6 and 2537.1. All recent trade signals have triggered on the short side, reinforcing the prevailing downside bias. Most weekly benchmarks, including the 5, 10, 100, and 200 week moving averages, are trending down, with only the 20 and 55 week MAs showing a slight uptrend, but these are being tested as price hovers just above or below them. The technical landscape suggests continued pressure, with the market unable to reclaim key resistance and failing to establish higher lows. The overall environment is characterized by persistent selling, failed rallies, and a lack of bullish momentum, pointing to a market in a corrective or distribution phase rather than a recovery or consolidation.
Chart Analysis ATS AI Generated: 2025-08-01 07:15 for Informational use only, not trading advice. Terms and Risk Disclosure Copyright © 2025. Algo Trading Systems LLC.
