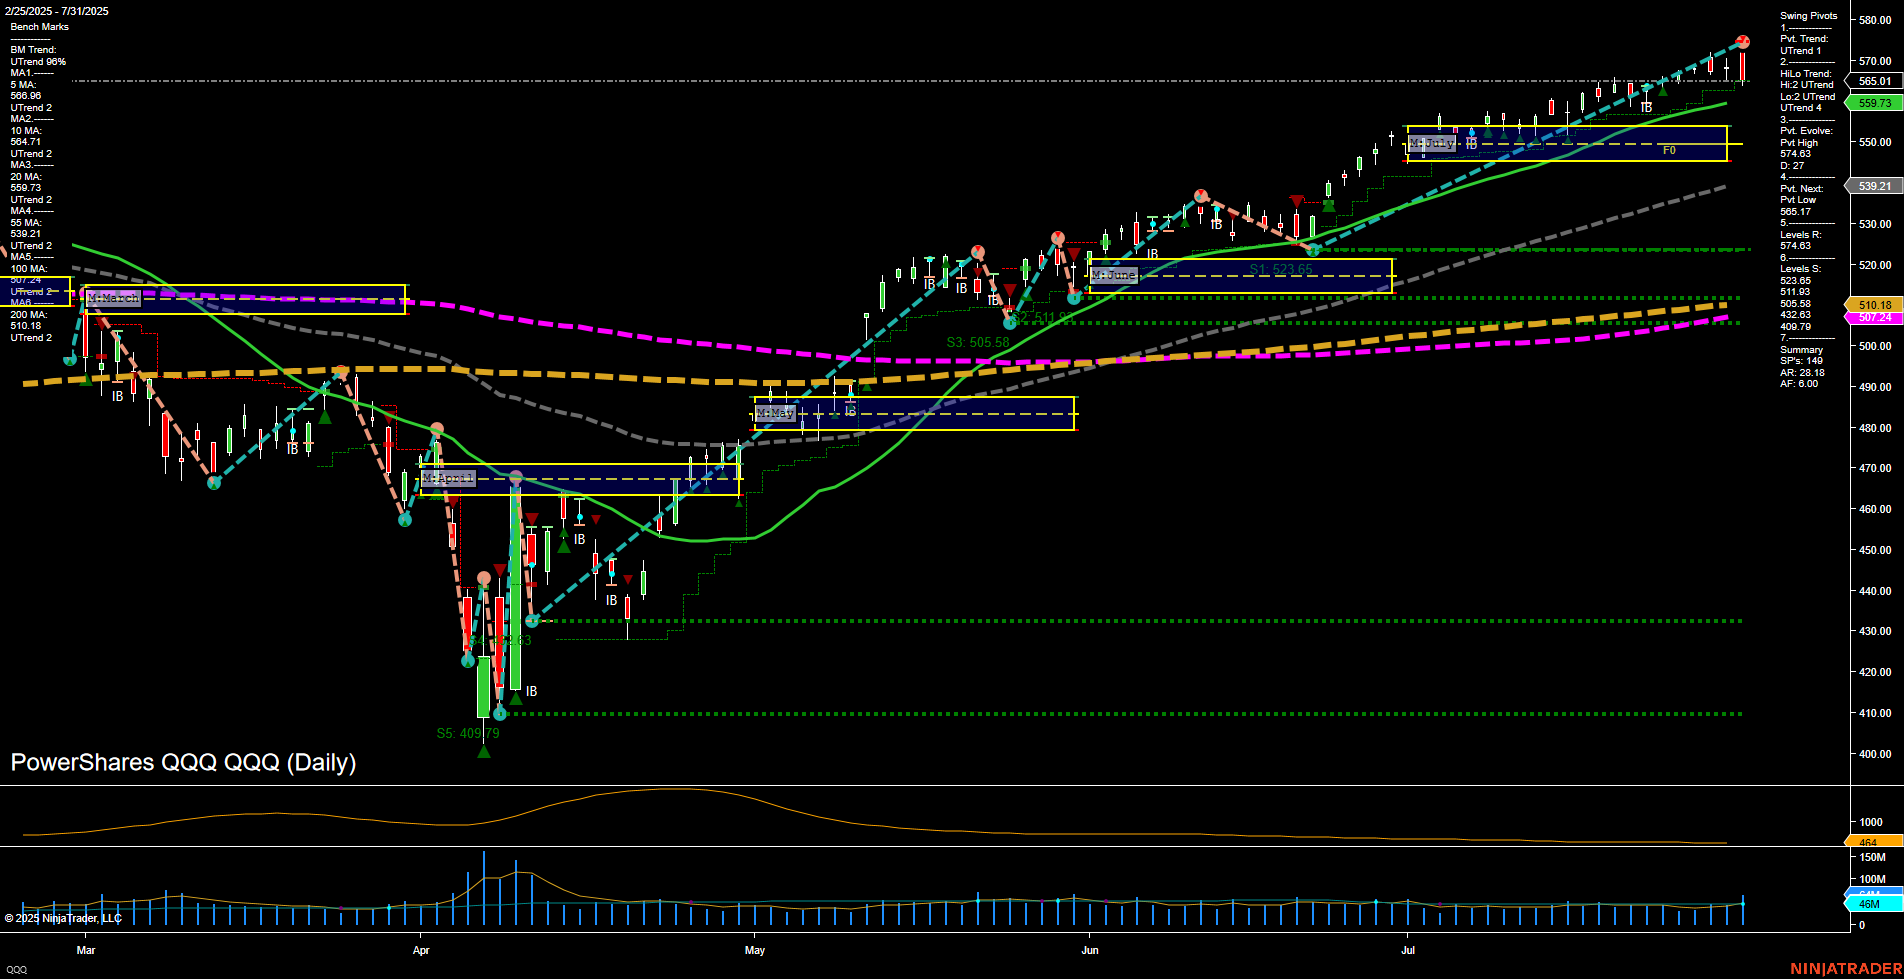
QQQ PowerShares QQQ Daily Chart Analysis: 2025-Aug-01 07:13 CT
Price Action
- Last: 565.01,
- Bars: Medium,
- Mom: Momentum average.
WSFG Weekly
- Short-Term
- WSFG Current: NA%
- F0%/NTZ' Bias: Price Neutral,
- WSFG Trend: Neutral.
MSFG Month Aug
- Intermediate-Term
- MSFG Current: NA%
- F0%/NTZ' Bias: Price Neutral,
- MSFG Trend: Neutral.
YSFG Year 2025
- Long-Term
- YSFG Current: NA%
- F0%/NTZ' Bias: Price Neutral,
- YSFG Trend: Neutral.
Swing Pivots
- (Short-Term) 1. Pvt. Trend: UTrend,
- (Intermediate-Term) 2. HiLo Trend: UTrend,
- 3. Pvt. Evolve: Pvt High 574.03,
- 4. Pvt. Next: Pvt Low 559.73,
- 5. Levels R: 574.03, 565.17, 561.85, 557.43,
- 6. Levels S: 559.73, 539.21, 505.58, 409.79.
Daily Benchmarks
- (Short-Term) 5 Day: 566.08 Up Trend,
- (Short-Term) 10 Day: 564.71 Up Trend,
- (Intermediate-Term) 20 Day: 559.73 Up Trend,
- (Intermediate-Term) 55 Day: 539.21 Up Trend,
- (Long-Term) 100 Day: 510.18 Up Trend,
- (Long-Term) 200 Day: 505.88 Up Trend.
Additional Metrics
- ATR: 733,
- VOLMA: 32709273.
Overall Rating
- Short-Term: Bullish,
- Intermediate-Term: Bullish,
- Long-Term: Bullish.
Key Insights Summary
The QQQ daily chart reflects a strong bullish structure across all timeframes, with price action maintaining above all key moving averages and a clear uptrend in both short- and intermediate-term swing pivots. The most recent swing high at 574.03 and the next potential support at 559.73 define the current trading range, with multiple resistance levels stacked above. The moving averages are all aligned in uptrends, confirming trend strength and momentum, while the ATR and volume metrics suggest steady but not extreme volatility. The neutral bias in the session fib grids indicates a lack of overextension, supporting the ongoing trend. The chart shows a series of higher lows and higher highs, with no immediate signs of reversal or exhaustion, and recent price action has respected support levels on pullbacks. This environment is typically characterized by trend continuation, with occasional consolidations and minor retracements, as seen in the recent price structure.
Chart Analysis ATS AI Generated: 2025-08-01 07:13 for Informational use only, not trading advice. Terms and Risk Disclosure Copyright © 2025. Algo Trading Systems LLC.
