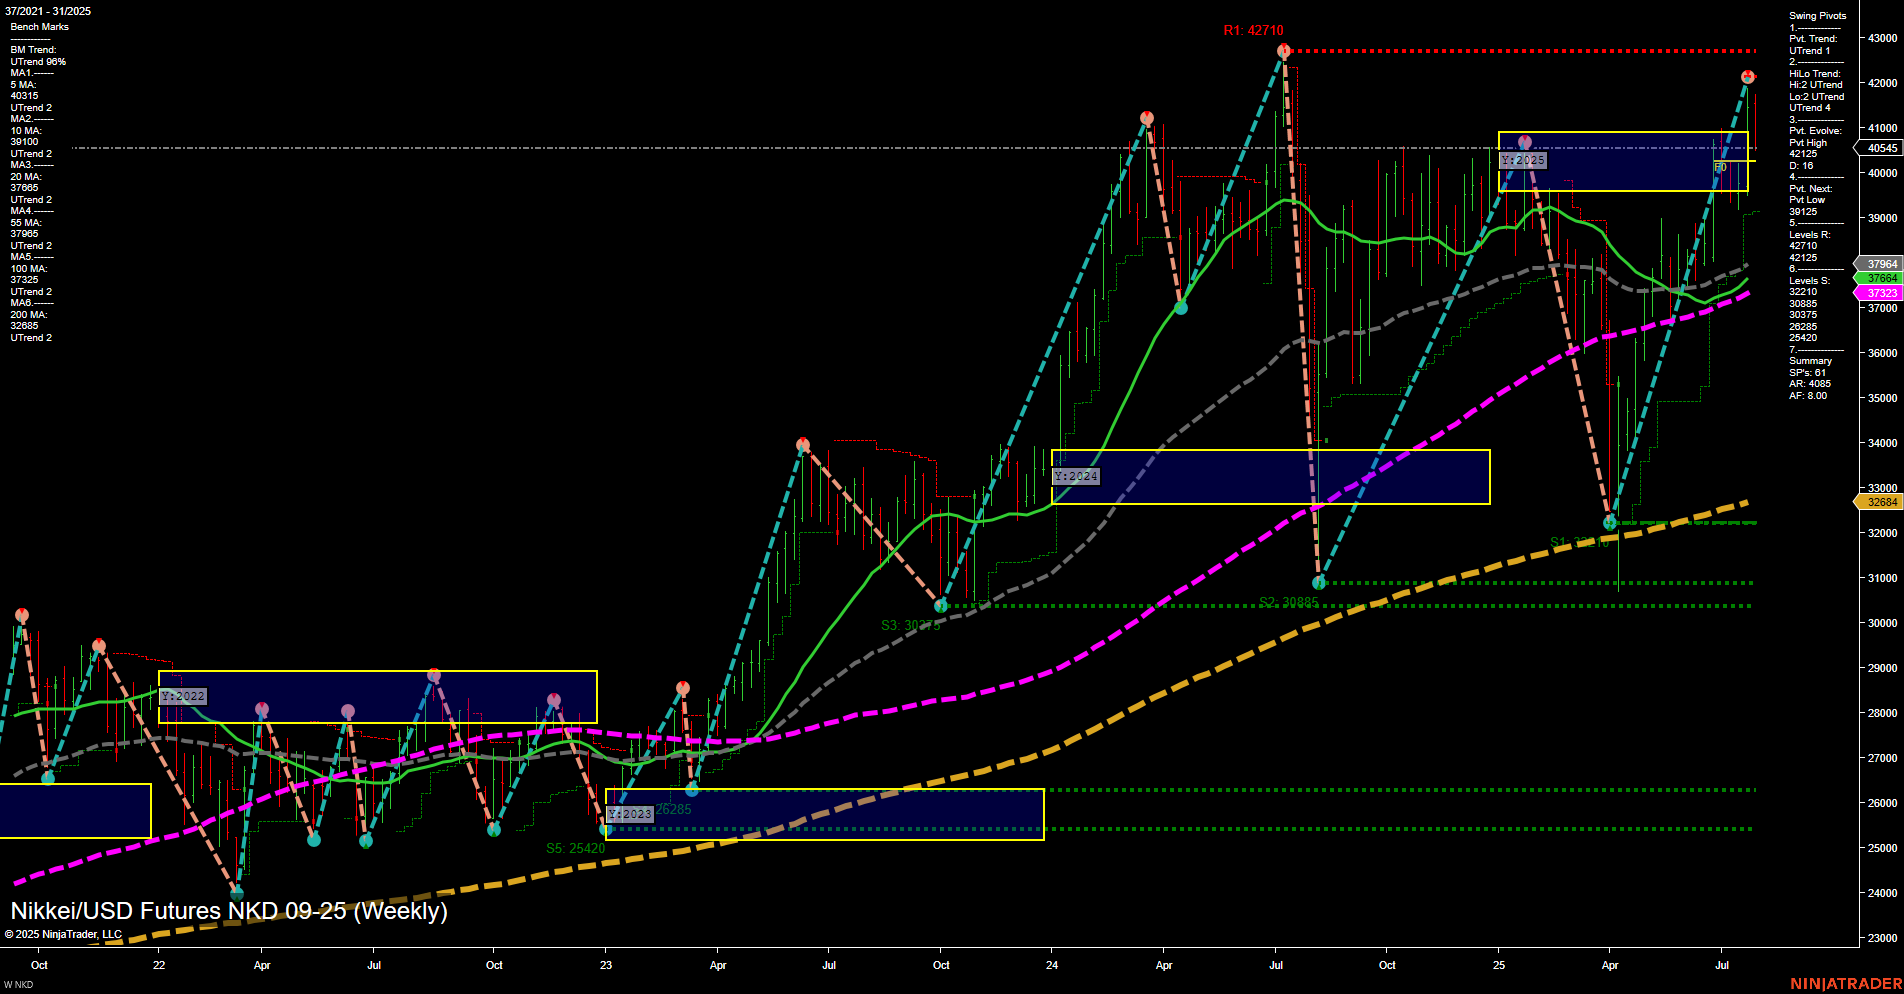
The NKD Nikkei/USD futures weekly chart shows a market that has recently experienced strong upward momentum, with large bars and fast price action pushing to a new swing high at 42,710. However, both the weekly and monthly session fib grids (WSFG and MSFG) indicate a short- and intermediate-term downtrend, with price currently below their respective NTZ/F0% levels. Despite this, the yearly session fib grid (YSFG) remains in an uptrend, with price above the yearly NTZ/F0%, supporting a bullish long-term outlook. Swing pivots confirm an uptrend in both short- and intermediate-term trends, but the most recent pivot is a high, suggesting a potential pullback or consolidation phase. Key resistance levels are clustered above the current price, while support is well-defined in the 37,000–38,000 range. All benchmark moving averages from 5 to 200 weeks are trending upward, reinforcing the underlying long-term strength. Recent trade signals show mixed short-term direction, with a short signal following a long, reflecting the current choppy and potentially volatile environment. Overall, the market is in a consolidation or corrective phase within a broader bullish trend, with the potential for further pullbacks before resuming upward momentum. Swing traders should be attentive to how price reacts at key support and resistance levels, as well as the evolving pivot structure, to gauge the next directional move.